


 Gold is meant to be a ‘safe haven’ in uncertain times. Why is it crashing amid a war?
  Time to buy local: war fuel price shocks reveal the folly of a long food supply chain
  Will a new border deal with the US open a backdoor into Kiwis’ personal data?
  Makemation: a Nollywood movie that shows AI in action in Africa
  Federal Reserve Balance Sheet Reduction: Brookings Research Outlines Possible Path Forward
  Goldman Sachs Raises Oil Price Forecasts Amid Strait of Hormuz Disruptions
  US-Iran Ceasefire Talks Underway: What You Need to Know
  What does China’s host bid mean for the High Seas Treaty?


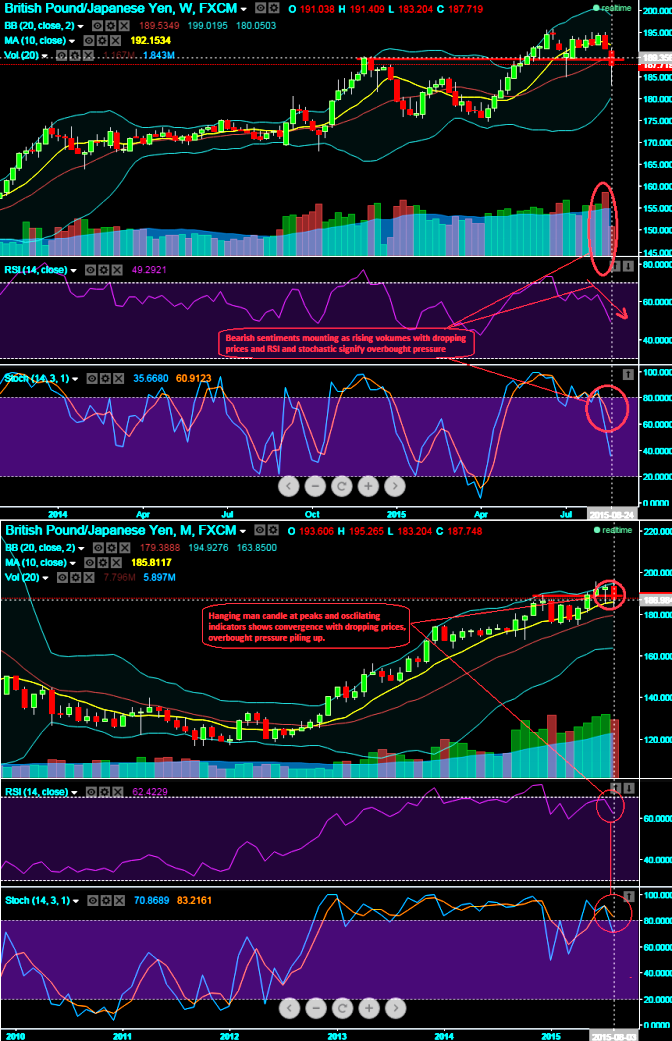
Technical briefing (GBP/JPY):
On monthly chart, the formation of hanging man pattern candle on peaks of uptrend at around 193.456 levels. This would reveal a mediumterm downtrend direction.
Overall pattern on the pair fixes it bearish view for a 183.125 and it's been a support breach as well at around 188.575. In addition to that huge volumes are popping up to show bearish sentiments, while leading oscillators (RSI & slow stochastic) show convergence with dipping prices at current levels.
RSI currently trend at 49.4183, while %D line crossover on stochastic 80 levels which alarms selling pressures mounting up.
Thus far we've been sensing selling sentiments during Asian sessions and we predict this would continue to hold on to test targets 1st - 184.076, 2nd - 183.125 levels. So, either shorting next month futures for above targets or buying ATM binary delta puts on rallies may fetch handsome returns from current levels.

- News

- Economy

- Central Banks
- Investing
- Research
- Roundups
- Digital Currency
- Insights
- Technical Analysis
- Technology
- Business
- Law
- Health
- Nature
- Fintech
- Science
- Topic
- Opinions
- ©Econometrics LLC . All Rights Reserved.
FxWirePro: GBY/JPY hanging man on peaks, volumes confirmation intensify bearish trend - fresh short build ups on rallies
Tuesday, August 25, 2015 7:16 AM UTC
Editor's Picks


- Market Data
Most Popular


