


 FxWirePro: GBP/USD hits one-month high, scope for further upside
  GBPJPY Bullish on Consolidation: Holds Above 216 After 218 Top – Buy Dips at 217 Targeting 220
  FxWirePro:EUR/NZD extends fall, key support lies ahead
  FxWirePro: GBP/AUD loses momentum but outlook is bullish
  Crypto Major Pair Action Bias: ETHUSD Bullish as BTCUSD, SOLUSD & XRPUSD Stay Neutral
  EUR/JPY Poised to Slide — Sell Rallies into 185.30 with Eye on 183"
  GBPUSD, AUDUSD & NZDUSD Turn Extremely Bullish: Strong Positive Momentum Drives Major Pair Action Bias
  ETHUSD Bullish Momentum: Follows BTC Above All EMAs, Buy Dips Near $1750 Targeting $2300
  FxWirePro: EUR/AUD bears maintain upper hand
  FxWirePro- Major Pair levels and bias summary
  FxWirePro: GBP/USD advance after softer US inflation dims Fed rate hike bets


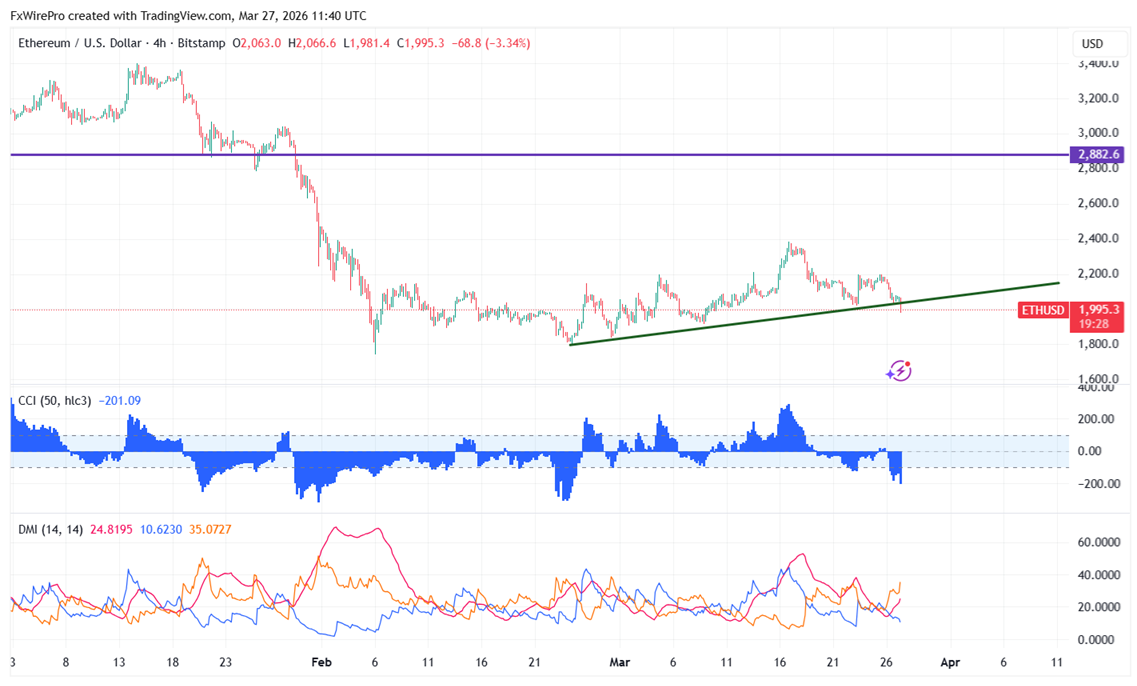
Ethereum pared some of its gains following the footsteps of BTC. After hitting a peak around $2199, it’s currently hovering near $2040.
|
Technicals |
CMP -$2040 |
Trend |
|
|
4- Hour chart |
Value |
|
|
|
55 EMA |
$2127 |
CMP < 55 EMA |
Bearish |
|
200- EMA |
$2128.50 |
CMP < 200- EMA |
Bearish |
|
365- EMA |
$2246 |
CMP < 365 EMA |
Bearish |
Major support- $1700/$1500. Minor bullishness only above $2200. Any violation above targets $2386/$2500/$2700/$2880/$3000.
|
Momentum indicator (4-hour chart) |
Inference |
Value |
|
CCI(50) |
Bearish |
-132 |
|
ADX |
Bearish |
Strength increased from 14.47 to 17.48 |
It is good to buy on dips around $2000 with SL around $1700 for a TP of $2770.


