


 FxWirePro: GBP/AUD bears maintain upper hand
  FxWirePro: AUD/USD cedes early gains ,outlook bearish
  US Magnificent 7 Stocks Trend Score: Amazon & Microsoft Hit Extreme Bullish (+100) as Meta Drops to -100 — Key Resistance & Support Watchlist
  FxWirePro: USD/CNY dips to hit three year low,scope for further downside
  FxWirePro: NZD/USD consolidates overnight gains, but loses momentum
  FxWirePro- Major Crypto levels and bias summary
  FxWirePro- Woodies pivot (Major)
  FxWirePro: USD/ZAR gains as stronger dollar outweighs upbeat South Africa's trade surplus
  FxWirePro- Major Pair levels and bias summary
  FxWirePro: USD/CNY downtrend loses steam, remains on bearish path
  US Magnificent 7 Stocks Trend Score: Amazon & Microsoft Hit Extreme Bullish (+100) as Meta Drops to -100 — Key Resistance & Support Watchlist
  FxWirePro:USD/JPY climbs back above 160.00 after BOJ rate decision
  AUDJPY Volatile After Massive Sell-Off: Sell Rallies at 113, Targeting 110 as Bearish Momentum Surges
  NZDJPY Retreats on Yen Strength – Bearish Setup Targets 90 After Hitting 92.75 Low
  Major European Indices Score Extremely Bullish: DAX Eyes 26000, CAC Targets 8600, FTSE100 at 11000 – Key Levels to Watch
  JPY Currency Meter Signals: NZDJPY Bullish (+25) vs CHFJPY (-100) – These Pairs Could Move Next
  Nikkei Surges Past 65,000 on Suspected Yen Weakness: Tech Giants Like Advantest and NEC Lead Explosive Gains


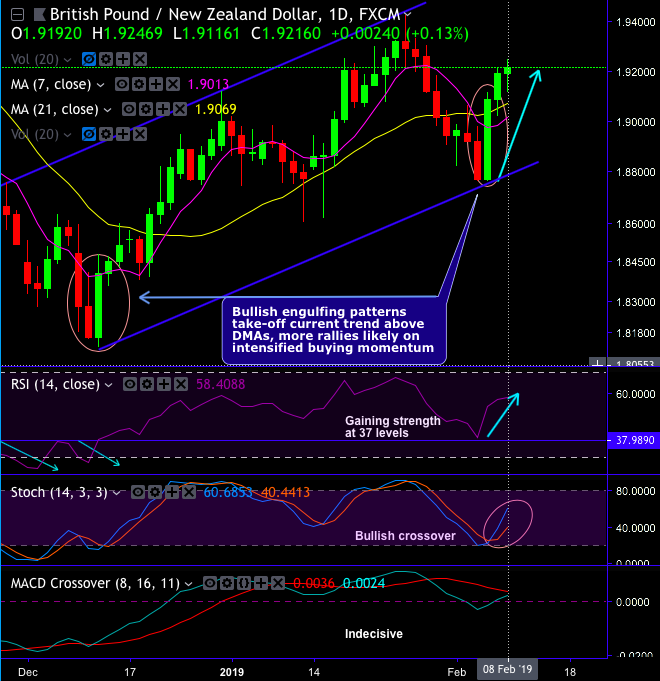
GBPNZD forms bullish engulfing candle at 1.8407 and 1.9085 levels on the daily chart, and back-to-back shooting stars at 1.9683 and 1.9589 levels on monthly plotting.
These bullish and bearish patterns signify the potential of the minor uptrend and major downtrend.
The minor trend of this pair has tested strong support at rising channel baseline (to be precise at 1.8760 levels, that is where the formation of bullish engulfing has begun), consequently, upswings have bounced back above DMAs (refer daily chart).
Momentum study: Both leading oscillators (RSI & stochastic curves) show upward convergence to the prevailing price rallies that signal the gaining strength and intensified bullish momentum on daily terms and vice versa on monthly terms.
On a broader perspective, the major trend has been drifting non-directional since December 2017, it has been sensing consolidation phase and lagging indicators substantiate this standpoint (refer monthly chart). Well on this timeframe, although ongoing bullish swings seem to be imminent, shooting star pattern coupled with momentum oscillators’ overbought pressures signal weakness. In the recent past, you could easily make-out the major trend has slid below 21EMAs.
Hence, the trading boundary option strategy is desirable for traders who reckon the price of an underlying asset would restrain between these price bands for some time, but who are unsure of the direction. Use upper strikes at 1.9432 and lower strikes at 1.8754 levels, as long as the underlying spot remains between these two strikes, yields are exponential than the underlying spot. For cash or nothing, these options would be exercised if the forward prices to remain between both strikes (i.e. 1.9432 > Fwd price > 1.8754).
Currency Strength Index: FxWirePro's hourly NZD spot index is inching towards -142 levels (which is bearish), GBP at 66 (bullish) while articulating (at 13:18 GMT).
For more details on the index, please refer below weblink: http://www.fxwirepro.com/currencyindex


