


 FxWirePro: EUR/AUD slips after surprise U.S. employment data
  FxWirePro: USD/CNY slips as strong China exports data Lift yuan
  FxWirePro- Major Pair levels and bias summary
  FxWirePro- Major Crypto levels and bias summary
  FxWirePro: GBP/AUD eases slightly, focus on near-term support
  Bitcoin Reclaims $65,000 as Easing Geopolitical Tensions Fuel Risk-On Rally
  FxWirePro: GBP/USD rises as weak U.S. jobs data pressures dollar
  NZDJPY Bears Lie in Wait: Sell Rallies at 93 for 90 Target with 94 Stop
  FxWirePro: GBP/USD eases as dollar firms ahead of U.S. June non-farm payrolls report
  AUDJPY Bears Poised: Sell Rallies at 111.55 for 108 Target with 112.20 Stop
  FxWirePro: USD/JPY holds tight range ahead of key U.S. payrolls data
  EUR/USD Rockets Past 1.1560 as Soft U.S. Jobs Data Fuel Fed Rate-Cut Surge
  FxWirePro: GBP/AUD under pressure after disappointing U.S. employment data
  FxWirePro : EUR/NZD holding below 38.2% fibo ahead of US data


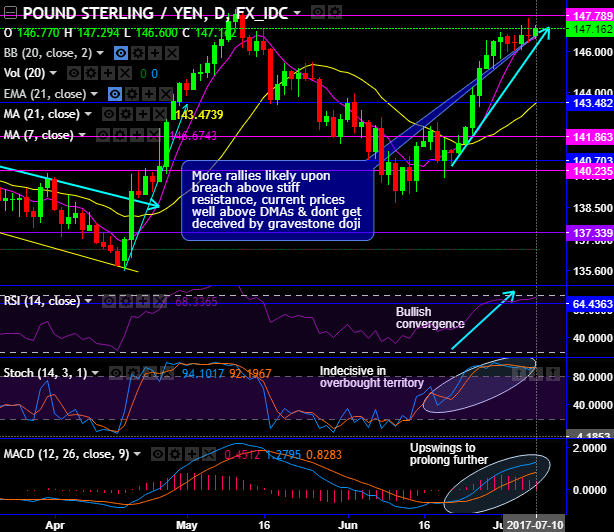
After retracing above 23.6% Fibonacci levels (on monthly) and bullish DMA crossover (on daily), the pair has managed to breach above 145.546 levels.
For now, more rallies on cards as both short and long term trend backed by both momentum and trend oscillators.
It has taken a strong support exactly at 7DMA levels (i.e. around day open), upswings likely to head towards next stiff resistance of 147.789 levels despite a gravestone doji formation (bearish formation) as the rallies likely to extend upon confirmation from both leading & lagging indicators in daily terms.
Ever since it has shown the bullish crossover, the upswings so far have constantly beyond DMAs and sensing consistent support at 7SMA (daily charts) we foresee northwards journey upto next stiff resistance at 147.789 levels.
Please be noted that stochastic oscillator has entered into overbought trajectory but no traces of clear bearish crossover which means ongoing bullish sentiments are likely to continue but with a pinch of salt. While RSI has also shown the strength in rallies at 68 levels, this leading indicator is also likely to enter into the overbought zone but showing bullish convergence.
Well on a broader perspective, it has breached 23.6% Fibonacci retracement levels decisively, consequently, one can expect more rallies upto 147-150 levels (i.e. 38.2% Fibos).
The stern buying momentum is observed on this timeframe, the leading oscillators have been consistently converging to uptrend at this juncture.
Monthly RSI (14) has gone above 50 levels that signal the intensified strength in buying interests, any shrink indicated by this indicator should be deemed as a caution for the aggressive bulls.
The same has been the case on stochastic curves, this oscillator has been indicating the healthy momentum in ongoing rallies.
To substantiate this bullish stance, MACD on the other hand, signals on both timeframes the extension of the bullish trend.
Trade tips:
Contemplating above daily bullish sentiment, on trading perspective, it is advisable to buy horizontal time spreads.
This strategy involves shorting and simultaneously adding longs options with different rates of time decay i.e. the Theta values are not the same on each option in the spread because one option expires before the other), these types of spreads are known as the calendar (or time) spreads. Use lower strikes for long leg and upper strike on the short leg with the short tenor.
Their source of potential profit, therefore, is a differential rate of time value decay on the two option legs in the spread.
Currency Strength Index: FxWirePro's hourly GBP spot index has turned into -69 (which is mildly bearish), while hourly JPY spot index was at -82 (highly bearish) at 05:52 GMT. For more details on the index, please refer below weblink:
http://www.fxwirepro.com/currencyindex.
FxWirePro launches Absolute Return Managed Program. For more details, visit:







