


 Vietnam’s population hit the 100 million milestone. Where’s it headed?
  In a rebuke to Trump, the Supreme Court rules that birthright citizenship is the law of the land
  Goldman Sachs Says China Competition Weighs More on EU Growth Than Trade Deficit
  Smartphones are helping filmmakers tell the stories the movie industry overlooks
  Alcohol is one of the most dangerous drugs, yet its presence is ubiquitous in social settings and celebrations
  Citi Raises TSMC Price Target as AI Chip Demand Strengthens Growth Outlook
  Goldman Sachs Raises USD/JPY Forecast, Sees Yen Weakness Persist Through 2027
  Buy the Dip: Gold Holds Strong at $3980, Targets $4150
  AI can be a personal trainer in your pocket – but is it safe?
  Bank of America Upgrades T-Mobile to Buy, Says LEO Satellite Fears Are Overdone
  Morgan Stanley Names BAE Systems Top European Defence Stock Despite Lower Price Target
  State of emergency in Crimea as Ukraine focuses pressure on ‘jewel in Putin’s crown’


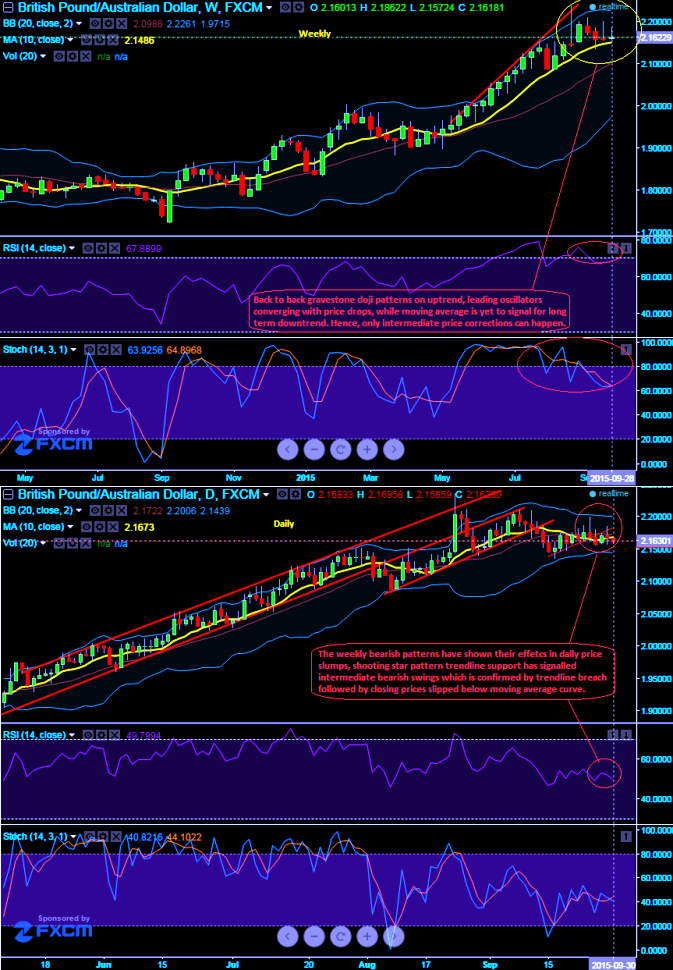
While we were designing long term hedging framework 14 week RSI was used with an objective to track price momentum over medium to long term perspectives. We traced back to back "Gravestone Doji" patterns on these charts at the peaks of uptrend which is now factoring their effects on daily charts. It was found in the last month at 2.1458 levels firstly, we again found the same pattern in last week at 2.1586 levels on a trendline breach.
The strength index curve approached 80 levels (i.e. overbought territory) and it was moving in convergence with dipping prices which signals selling momentum is intensifying. While %D crossover is also signifies the selling pressure at current levels.
Moving onto daily charts, here we again found an intimacy in the trend that suggested by weekly charts as shooting star here again on the trendline support at around 2.1685 levels has factored in daily prices. Current spot FX is ticking at 2.1624 which means almost 60 pips drop from shooting star formation. Overall, we would foresee an intermediate price correction in this pair.
For a swing trader it is all too easy to be carried away by a market that apparently knows no bounds. While slow stochastic on the other hand has neither remained in overbought nor oversold territory and it is signifying slight indecision.

- News

- Economy

- Central Banks
- Investing
- Research
- Roundups
- Digital Currency
- Insights
- Technical Analysis
- Technology
- Business
- Law
- Health
- Nature
- Fintech
- Science
- Topic
- Opinions
- ©Econometrics LLC . All Rights Reserved.
FxWirePro: GBP/AUD weekly doji’s signal bears to take over intermediate trend
Wednesday, September 30, 2015 8:32 AM UTC
Editor's Picks


- Market Data
Most Popular


