


 FxWirePro: USD/CAD retreats after Canada posts stronger-than-expected GDP growth
  US Magnificent 7 Stocks Trend Score: Amazon & Microsoft Hit Extreme Bullish (+100) as Meta Drops to -100 — Key Resistance & Support Watchlist
  JPY Currency Meter Signals: NZDJPY Bullish (+25) vs CHFJPY (-100) – These Pairs Could Move Next
  Nikkei Surges Past 65,000 on Suspected Yen Weakness: Tech Giants Like Advantest and NEC Lead Explosive Gains
  NZDJPY Bears Stay in Command: Sell Rallies at 92.72-75 Targeting 90 as All EMAs Flash Red
  Major European Indices Score Extremely Bullish: DAX Eyes 26000, CAC Targets 8600, FTSE100 at 11000 – Key Levels to Watch
  FxWirePro: GBP/NZD remains weak, eyes 38.2%fib support
  FxWirePro: GBP/AUD bears maintain upper hand
  FxWirePro: USD/CNY dips to hit three year low,scope for further downside
  AUDJPY Bears Tighten Grip: Sell Rallies at 110.65-67 Targeting 107.75 as All EMAs Stay Red
  FxWirePro- Major Crypto levels and bias summary
  FxWirePro:USD/JPY climbs back above 160.00 after BOJ rate decision
  FxWirePro: USD/ZAR gains as stronger dollar outweighs upbeat South Africa's trade surplus
  FxWirePro- Major Pair levels and bias summary
  FxWirePro: USD/CNY downtrend loses steam, remains on bearish path
  DAX & CAC40 Score Perfect 100 Trend, FTSE100 Lags at 85 – Key Levels to Watch on the Perfect Scorers


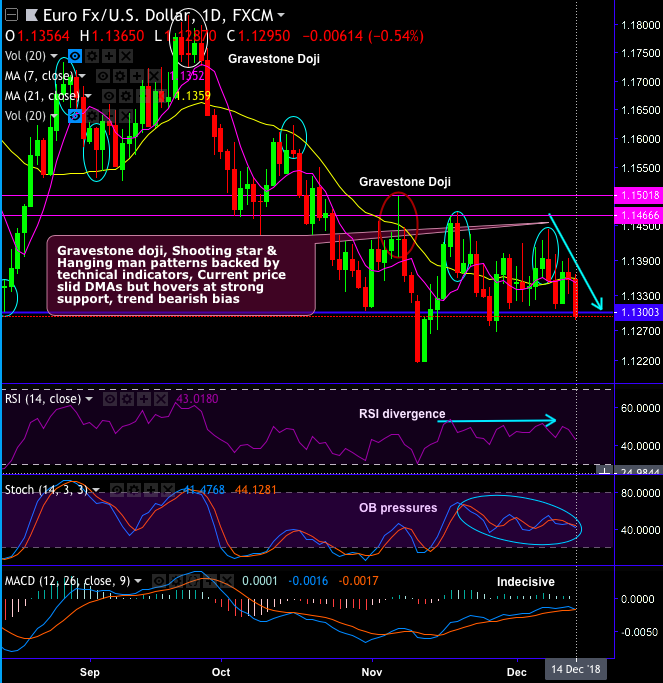
EURUSD tumbles below 1.13 levels today, the weakness of this pair is observed on the occurrence of shooting star, bearish engulfing and gravestone doji pattern candlesticks at the stiff resistance zone (i.e. 1.1466 - 1.1501 levels).
For now, price dips seem to be most likely on RSI’s divergence that indicates overbought pressures (refer daily chart).
Importantly, bears have managed to breach below strong support at 1.13 levels, while these bearish sentiments are backed by technical indicators, Current price slid DMAs but hovers at strong support, trend bearish bias.
While the major downtrend has been sliding through sloping channel, where bears retrace 61.8% Fibonacci levels from 2018 highs on the failure swings at channel resistance as both leading oscillators signal bearish momentum (refer monthly chart).
Shooting star, hanging man pattern pops-up at peaks in the major trend, ever since then you could make out bears have shown their effects, steep slumps have gone below EMA levels and retraced more than 61.8% Fibonacci levels of January 2018 highs (i.e. 1.2612) and January 2017 lows (i.e. 1.0371 levels) (refer monthly chart).
Overall, the current price still remains well below 21-EMAs despite today’s rallies in a short-run, bears are most likely to extend 1 and half year lows.
We could foresee more slumps on cards as both leading oscillators (RSI and stochastic curves) and both trend indicators (DMAs, EMAs & MACD) have been signaling intensified bearish momentum and downtrend continuation respectively.
Trade tips: At spot reference: 1.1289 levels, contemplating above technical rationale, one can execute one touch put options strategy. Such exotic option with lower strikes at 1.1216 levels of 1m tenor has favor slightly the prevailing selling sentiments.
Alternatively, shorting futures of mid-month tenors are advocated with a view of arresting further potential slumps. Writers in a futures contract are expected to maintain margins in order to open and maintain a short futures position.
Currency Strength Index: FxWirePro's hourly EUR spot index is inching towards -63 levels (which is bearish), while hourly USD spot index was at 79 (bullish) while articulating (at 11:43 GMT).
For more details on the index, please refer below weblink: http://www.fxwirepro.com/currencyindex







