


 FxWirePro: USD/CAD eases slightly but trend is still bullish
  FxWirePro: USD/ZAR extends decline, scope for further downside
  FxWirePro: GBP/AUD edges lower, bearish outlook persists
  EURGBP Bears Break Trendline: Sell Rallies at 0.8578 as Support Breach Eyes 0.8450 Slide
  AUDJPY Momentum Fades at 111: Sell Rallies to 108 as Bearish EMAs Dominate
  FxWirePro: AUD/USD eases slightly as markets await U.S. Payrolls report
  Gold Hits 6-Week High: Buy Dips at $4220 as Bullish Momentum Eyes $4400 Breakout
  FxWirePro- Major Pair levels and bias summary
  FxWirePro : EUR/NZD gains upside momentum but still bearish
  Crypto Action Bias: BNB/USD Leads Bullish Momentum as Major Pairs Neutralize
  Major Pair Currency Scores: GBPUSD, USDCAD, AUDUSD & NZDUSD Lead as Top Bullish Pairs to Watch
  FxWirePro: USD/JPY edges higher as traders eye U.S. Jobs data and Geopolitical developments
  AUDJPY Bears Hold the Line: Sell Rallies at 111.40 as Negative Bias Targets Sharp Drop to 108
  FxWirePro: EUR/AUD gains slightly, but downward resumption looks likely
  EURUSD Bulls Charge Higher: Buy Dips at 1.1528 as EMA Alignment Eyes Break Above 1.1560


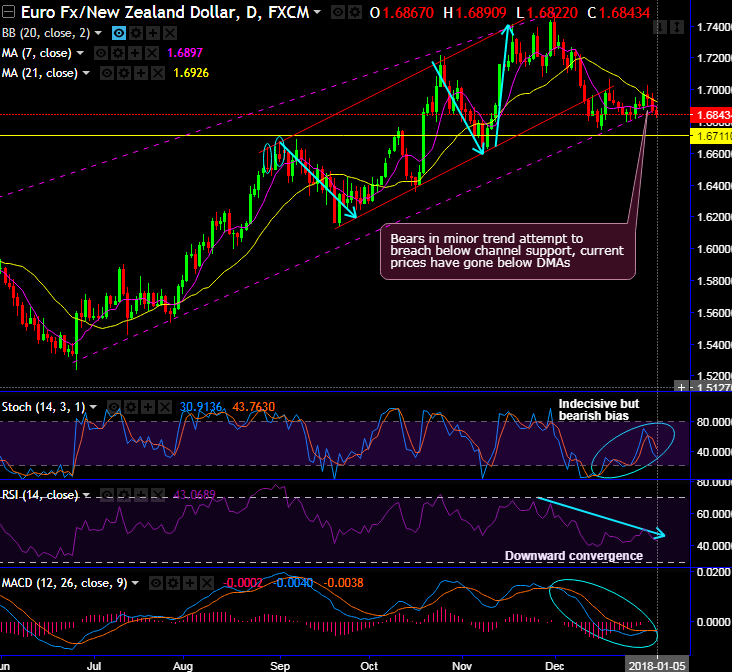
Chart pattern formed- Rising channel (on daily plotting) and double bottom pattern with bottom 1 at 1.3881 and 1.4534 levels (on monthly plotting).
The double bottom pattern helps in recognizing the higher probability opportunities to buy, or go "long."
Whereas the short-term trend has recently been testing the channel support at 1.6744 and 1.6794 levels, consequently, made a fake high upto 1.7064 and 1.7026.
That’s where shooting star has occurred and shown the failure swings, as a result, the bears are attempting to break below channel support hovering below 7DMAs.
The current price drop below DMAs are seen today, one could observe selling pressures are backed by both leading oscillators.
RSI, so far, has been converging downwards along with the price drops, that signals the strength in the downtrend. Stochastic curves have been indecisive but slightly bearish bias.
On a broader perspective, the major trend forms the double bottom pattern with bottom 1 at 1.3881 and bottom 2 at 1.4534 levels.
Stiff resistance is observed at 1.7285 and 1.8552 levels. It seems little puzzling whether this double bottom pattern can break-out these stiff resistance levels?
The current price spikes above EMAs with bullish crossover, the sustenance above will extend rallies.
Both lagging indicators (EMAs and MACD) substantiate this bullish environment (refer monthly chart) while leading oscillators have been popping up selling pressures.
7EMA crosses over 21EMA levels which is bullish EMA crossover that indicates the uptrend extension further which is in line with the above stated bullish chart pattern.
Additionally, MACD has also shown bullish crossover which is again a substantiation to prolong the prevailing uptrend (refer monthly plotting).
Trade tips:
Contemplating above bearish environment coupled by the momentum oscillators, it is wise to buy one touch binary put options strategy, the strategy is likely to fetch leveraged yields as long as underlying spot FX keeps dipping southward on or before the binary expiry duration.
Alternatively, as the major trend continues to inch higher, we advocate bidding longs in the futures contracts of mid-month tenors to mitigate upside risks.
Currency Strength Index: FxWirePro's hourly EUR spot index is displaying shy above 82 levels (highly bullish), while hourly NZD spot index was inching higher towards 113 (highly bullish) while articulating (at 11:28 GMT). For more details on the index, please refer below weblink:
http://www.fxwirepro.com/currencyindex
FxWirePro launches Absolute Return Managed Program. For more details, visit:







