


 FxWirePro: AUD/USD dips after RBA Governor speech
  EUR/USD Bounces from Monthly Low, But Bearish Pressure Remains
  NZDJPY Action Bias: Bullish Dip-Buying Opportunity on Broad Yen Weakness
  FxWirePro- Woodies pivot (Major)
  FxWirePro: USD/CAD runs out of steam but maintains bullish outlook
  JPY Action Bias: USDJPY Emerges as the Clear Bullish Pair to Watch Amid Mixed Crosses
  FxWirePro: USD/CAD gaining momentum for a move towards 1.4200 level
  FxWirePro- Major Crypto levels and bias summary
  FxWirePro: EUR/AUD outlook weaker on renewed downside pressure
  FxWirePro : USD/JPY holds relatively bid on 163 ahead Of FOMC,BoJ meetings
  Crypto Action Bias: ETHUSD Stands Out as the Bullish Pair to Watch
  GBPJPY Slips After Sterling Weakness, Bears Eye 216
  FxWirePro- Major Pair levels and bias summary
  FxWirePro: USD/ZAR retreats but trend is still bullish
  NZDJPY Pullback: Sell Rallies Toward 93.30 as Yen Weakness Eases
  Major Pairs Action Bias: USDCAD and USDCHF Stand Out as Extremely Bullish While GBPUSD and NZDUSD Turn Extremely Bearish
  FxWirePro: GBP/NZD gains some ground but bias is still bearish


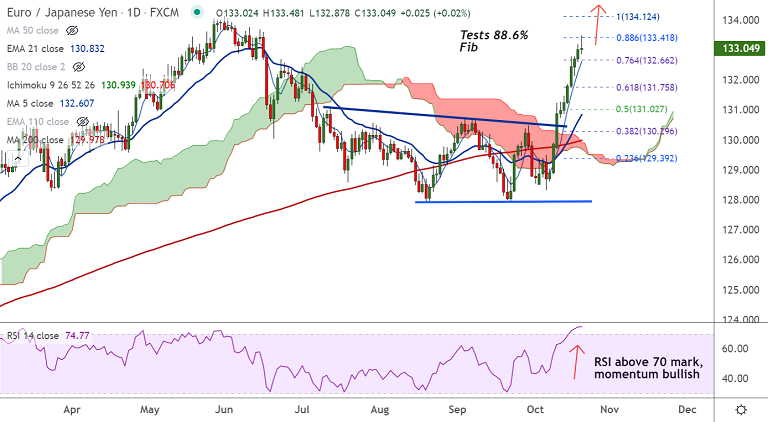
EUR/JPY chart - Trading View
Spot Analysis:
EUR/JPY was trading 0.02% higher on the day at 133.05 at around 09:10 GMT. The pair refreshed 4-month highs at 133.48 in early trade before slipping lower.
Previous Week's High/ Low: 132.77/ 129.70
Previous Session's High/ Low: 133.19/ 132.62
Data Released:
Data released by Eurostat showed Eurozone final CPI for September printed at 3.4% on a yearly basis, in line with the flash estimate of 3.4% and 3.4% expectations. While the core figures rose by 1.9%, matching consensus.
On a monthly basis, the bloc’s CPI figure for September arrived at 0.5% versus 0.5% expectations and 0.4% previous while the core CPI numbers came in at 0.5% versus 0.5% expected and 0.5% last.
Technical Analysis:
- EUR/JPY forms Doji at highs, on track to snap 9-day bullish streak
- MACD is showing a bullish bias, ADX is rising in support of upside
- Momentum is strongly bullish and volatility is high
- Price action has edged above 200-month MA
- GMMA indicator shows major and minor trend are bullish on the daily charts
Major Support and Resistance Levels:
Support - 132.60 (5-DMA), Resistance - 133.41 (88.6% Fib)
Summary: EUR/JPY trades with a strong bullish bias. Overbought conditions may see some pullbacks. Monthly close above 200 MA will fuel further gains.


