


 Elon Musk is remaking the world, like Henry Ford before him – but more dangerously
  Morgan Stanley Names BAE Systems Top European Defence Stock Despite Lower Price Target
  Buy the Dip: Gold Holds Strong at $3980, Targets $4150
  Goldman Sachs Raises USD/JPY Forecast, Sees Yen Weakness Persist Through 2027
  Citi Raises TSMC Price Target as AI Chip Demand Strengthens Growth Outlook
  Alcohol is one of the most dangerous drugs, yet its presence is ubiquitous in social settings and celebrations
  Trump has made more than $1 billion from crypto in a year. How?
  Goldman Sachs Says China Competition Weighs More on EU Growth Than Trade Deficit
  In a rebuke to Trump, the Supreme Court rules that birthright citizenship is the law of the land
  USA at 250: the Black American struggle for life, liberty and the pursuit of happiness
  Vietnam’s population hit the 100 million milestone. Where’s it headed?


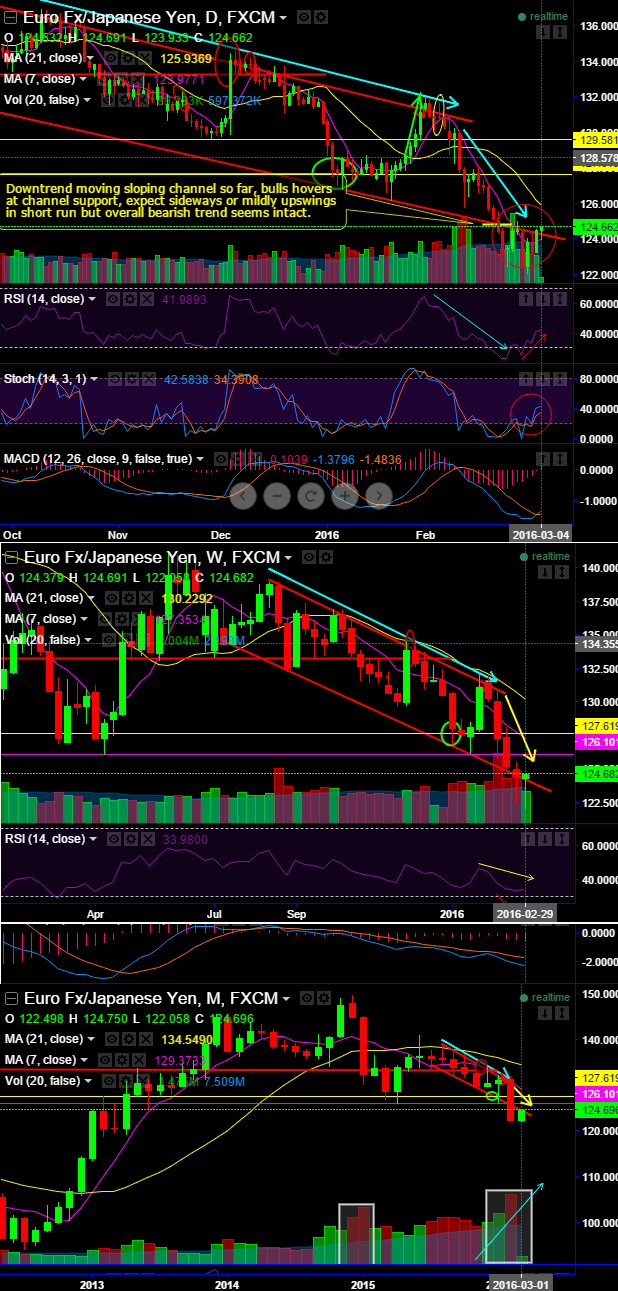
Previous downtrend offers more shorting opportunities by generating some momentary gais, yes we are referring about last 3-4 days jump from the lows of 122.058 to the current 124.730 levels. we perceive these rallies as short covering rallies and creating an opportunity for fresh shorting opportunity.
The pair is still steaming up with heaps of bearish indication by leading oscillator in addition.
Currently, on weekly plotting RSI (14) trending near 33.3117 levels (while articulating) with downward convergence to the dipping prices.
The current price behaviour is forming a sloping channel, it is still struggling to bounce above this channel support. Whereas, bears taking over the rallies to evidence every dips with ease and with huge volumes (see weekly & monthly charts for bear candles with big real body and volumes conformity).
Most importantly, massive volume build ups on every price decline confirms downtrend (you can see grey shaded areas on monthly charts).
As a result, both weekly and monthly prices have slipped below 10DMA, hence it is perceived as ongoing downtrend would drag further. Currently, attempting to jump above channel support at 124.725 levels.
Most probable scenario would be that it may show maximum jump upto 125.141 levels (minor resistance) and then slip back again to channel support.
Hence, using these deceptive rallies, you decide to initiate a bull put spread at net credits, short 1W (-1%) in the money put with positive theta if you expect that EURJPY will spike up moderately over the next near future but certainly not beyond your imagination, simultaneously, buy next month at the money -0.5 delta put option.
Notice in this instance that the put we bought is out of the money and the put we sold is in the money with an anticipation of EURJPY could rise or remain unchanged, and there onwards any abrupt fall would be taken care by longs in OTM put and your active longs in spot FX would be protected.
Maximum profit: The initial credit received for this trade which is certain, after 1W if it continues its bearish business cash flows would be exponential.
The maximum risk is the difference between the two strike prices, minus the credit you received.

- News

- Economy

- Central Banks
- Investing
- Research
- Roundups
- Digital Currency
- Insights
- Technical Analysis
- Technology
- Business
- Law
- Health
- Nature
- Fintech
- Science
- Topic
- Opinions
- ©Econometrics LLC . All Rights Reserved.
FxWirePro: EUR/JPY lingers on channel support, expect sideways or slightly upward bias- yet make money via credit put spreads
Friday, March 4, 2016 6:28 AM UTC
Editor's Picks


- Market Data
Most Popular


