


 U.S. Stocks vs. Bonds: Are Diverging Valuations Signaling a Shift?
  Mexico's Undervalued Equity Market Offers Long-Term Investment Potential
  FxWirePro- Major Crypto levels and bias summary
  Aussie-Yen Trapped Below 113: Sell the Bounce as Bears Reload for a Run at 110
  FxWirePro: USD/CNY hits one –month high, scope for further upside
  Peace Dividend Powers NZDJPY Past 93.50 — Bulls Set Sights on 96.15 Target
  Energy Sector Outlook 2025: AI's Role and Market Dynamics
  NZD/JPY Loses Its Shine: Kiwi Cracks Under Pressure as Bears Target 91.80
  Moldova Criticizes Russia Amid Transdniestria Energy Crisis
  Lithium Market Poised for Recovery Amid Supply Cuts and Rising Demand
  FxWirePro: USD/JPY edges higher as the yen remains vulnerable despite repeated warnings of intervention.
  Wall Street Analysts Weigh in on Latest NFP Data
  FxWirePro: AUD/USD eases after Australian mixed CPI data
  FxWirePro: AUD/USD climbs as US-Iran peace deal sparks risk rally
  Trump’s "Shock and Awe" Agenda: Executive Orders from Day One
  FxWirePro: GBP/USD slides toward critical support market reassesses UK political transition
  Pound-Yen Pullback: GBP/JPY Slips Below Key EMAs as Sterling Weakness Fuels Bearish Bet on 210


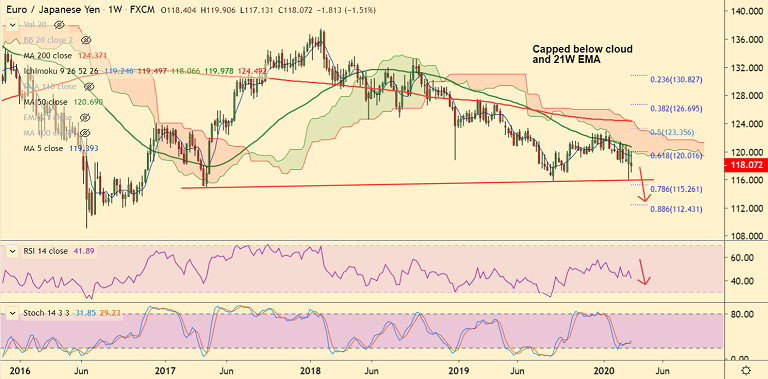
EUR/JPY chart - Trading View
EUR/JPY has failed to sustain Friday's massive gains. Upside has been capped at 200-DMA which is stiff resistance (currently at 120.10).
After a few extremely volatile sessions, the pair is currently trading 0.30% lower on the day at 118.03 at around 10:40 GMT.
Back-to-back long-legged Dojis on the daily charts suggests selling pressure and highs.
Major and minor trend for the pair are bearish as evidenced by the downward sloping moving averages in the GMMA indicator.
Price action is capped below weekly cloud and 21W EMA (currently at 120.057). Momentum is bearish and RSI is below 50.
Resumption of downside likely. Next bear target lies at 116 (trendline) ahead of 78.6% Fib at 115.26.
Support levels - 116 (trendline), 115.26 (78.6% Fib)
Resistance levels - 119.02 (21-EMA), 120.10 (200-DMA)
Recommendation: Good to stay short on upticks around 118.20-118.60, SL: 120.00, TP: 117.70/ 117/ 116.


