


 FxWirePro- Major Pair levels and bias summary
  NZDJPY Action Bias: Bullish Dip-Buying Opportunity on Broad Yen Weakness
  NZDJPY Pullback: Sell Rallies Toward 93.30 as Yen Weakness Eases
  GBPJPY Slips After Sterling Weakness, Bears Eye 216
  FxWirePro- Major Crypto levels and bias summary
  FxWirePro- Woodies pivot (Major)
  AUDJPY Weakness Deepens: Sell Rallies Toward 112 as Aussie Dollar Falters
  AUDJPY Action Bias: Bullish Dip-Buy Setup Despite Flat Neutral Bias
  FxWirePro: USD/ZAR retreats but trend is still bullish
  FxWirePro: USD/ZAR uptrend loses steam, remains on bullish path
  FxWirePro: EUR/AUD outlook weaker on renewed downside pressure
  FxWirePro: GBP/NZD gains some ground but bias is still bearish
  EUR/USD Bounces from Monthly Low, But Bearish Pressure Remains
  FxWirePro: NZD/USD edges lower, remains on back foot


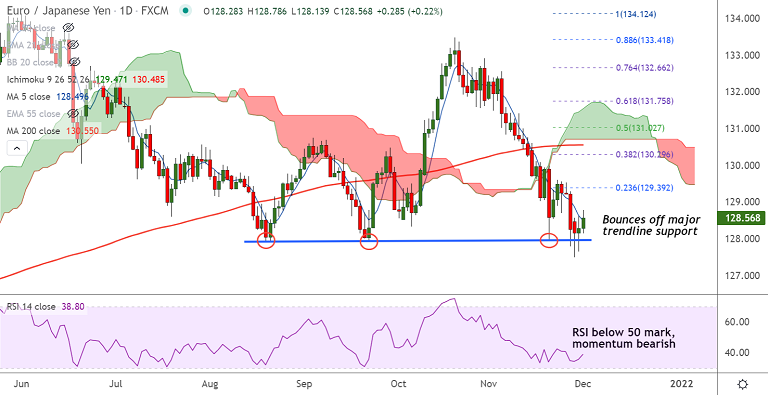
Chart - Courtesy Trading View
Technical Analysis: Bias Neutral
GMMA Indicator
- Shows strong bearish bias on near and long term moving averages on daily charts
- Bias on the intraday charts has gone neutral
Ichimoku Analysis
- Price action well below the daily cloud
- The pair is trading within the weekly cloud
Oscillators
- Stochs and RSI are on verge of bullish rollover from oversold levels
- RSI is well below the 50 mark and shows strength in the current downtrend
Bollinger Bands
- Bollinger bands are spread wide apart, but gap is shrinking
- Volatility is high, likely to add fuel to the downside momentum
Major Support Levels: 127.93 (trendline support), 127.15 (110-week EMA)
Major Resistance Levels: 128.78 (200H MA), 128.85 (55-week EMA)
Summary: EUR/JPY has paused downside at major trendline support at 127.93. Decisive break below is required for further weakness.







