


 FxWirePro: USD/ZAR uptrend loses steam, remains on bullish path
  Major Pairs Action Bias: USDCAD and USDCHF Stand Out as Extremely Bullish While GBPUSD and NZDUSD Turn Extremely Bearish
  Crypto Action Bias: ETHUSD Stands Out as the Bullish Pair to Watch
  FxWirePro: EUR/AUD outlook weaker on renewed downside pressure
  FxWirePro: USD/ZAR retreats but trend is still bullish
  GBPJPY Slips After Sterling Weakness, Bears Eye 216
  FxWirePro- Major Pair levels and bias summary
  NZDJPY Pullback: Sell Rallies Toward 93.30 as Yen Weakness Eases
  FxWirePro- Major Pair levels and bias summary
  FxWirePro- Major Crypto levels and bias summary
  JPY Action Bias: USDJPY Emerges as the Clear Bullish Pair to Watch Amid Mixed Crosses
  AUDJPY Action Bias: Bullish Dip-Buy Setup Despite Flat Neutral Bias
  NZDJPY Action Bias: Bullish Dip-Buying Opportunity on Broad Yen Weakness
  FxWirePro : USD/JPY holds relatively bid on 163 ahead Of FOMC,BoJ meetings
  Major Pair Action Bias: Bullish Pairs to Watch Out For


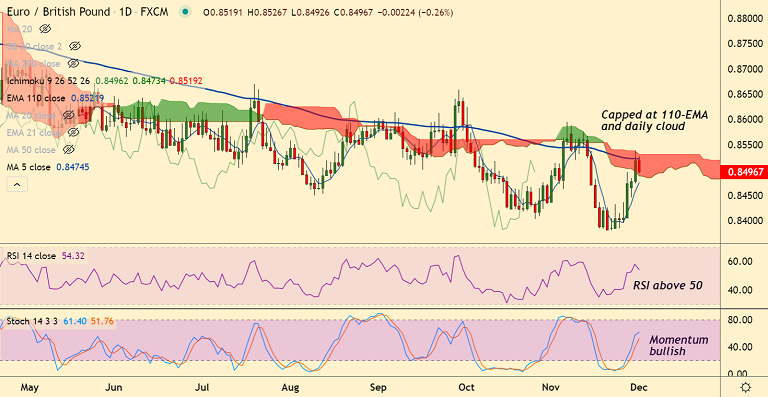
Chart - Courtesy Trading View
Technical Analysis:
GMMA Indicator
- Daily: Major trend is bearish, minor trend has turned bullish
- Hourly: Major and minor trend are bullish
Ichimoku Analysis
- Price action remains capped inside the daily cloud
- The pair trades well below the weekly cloud
Oscillators
- Stochs and RSI show bullish momentum
- RSI is well above the 50 mark, supporting the current uptrend
Bollinger Bands
- Bollinger bands are spread wide apart, gap is increasing
- Volatility is high and rising
Major Support Levels: 0.8487 (55-EMA), 0.8465 (21-EMA)
Major Resistance Levels: 0.8522 (110-EMA), 0.8558 (200-DMA)
Summary: EUR/GBP capped at 110-EMA and daily cloud. Decisive break above will see further upside. Scope for test of 200-DMA at 0.8558.


