


 FxWirePro: GBP/AUD runs out of steam but maintains bullish outlook
  2025 Market Outlook: Key January Events to Watch
  FxWirePro- Woodies pivot (Major)
  U.S. Treasury Yields Expected to Decline Amid Cooling Economic Pressures
  Fed-ECB Policy Chasm Sends EURUSD Tumbling to 1.1375; Bearish Momentum Builds Toward 1.1300
  Bank of America Posts Strong Q4 2024 Results, Shares Rise
  Trump’s "Shock and Awe" Agenda: Executive Orders from Day One
  Indonesia Surprises Markets with Interest Rate Cut Amid Currency Pressure
  Goldman Predicts 50% Odds of 10% U.S. Tariff on Copper by Q1 Close
  NZD/JPY Loses Its Shine: Kiwi Cracks Under Pressure as Bears Target 91.80
  FxWirePro: USD/CNY hits one –month high, scope for further upside
  Aussie-Yen Trapped Below 113: Sell the Bounce as Bears Reload for a Run at 110
  FxWirePro- Woodies pivot (Major)
  European Stocks Rally on Chinese Growth and Mining Merger Speculation
  FxWirePro- Major Pair levels and bias summary


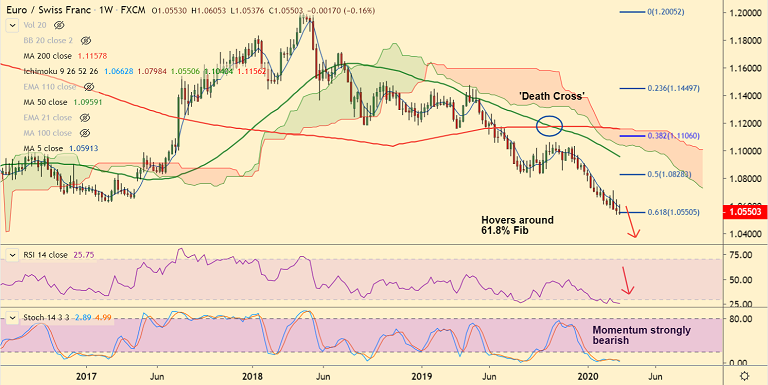
EUR/CHF chart - Trading View
Technical Analysis: Bias Bearish
Daily Chart:
- GMMA shows major and minor trend are sharply bearish
- Parabolic SAR supports weakness, Stochs and RSI are sharply lower
- Volatility is rising, 21-EMA caps upside and price has retraced below 5-DMA support
- 'Death Cross' on the hourly charts to plummet prices further
1H Chart:
- Price action is below 200H MA and hourly cloud
- Volatility is rising as evidenced by widening Bollinger Bands
- GMMA shows major trend is neutral, while minor trend is bearish
Major Support Levels - 1.0550 (61.8% Fib), 1.0280 (May 2015 low)
Major Resistance Levels - 1.0578 (200H MA), 1.0606 (21-EMA)
Summary: Further weakness in the pair likely. Drag till 1.0280 (May 2015 low) likely. Upticks could be used to accumulate short positions. Decisive breakout at 200-DMA (currently at 1.0895) could negate near-term bearish bias.


