


 Alcohol is one of the most dangerous drugs, yet its presence is ubiquitous in social settings and celebrations
  Smartphones are helping filmmakers tell the stories the movie industry overlooks
  In a rebuke to Trump, the Supreme Court rules that birthright citizenship is the law of the land
  Morgan Stanley Names BAE Systems Top European Defence Stock Despite Lower Price Target
  USA at 250: the Black American struggle for life, liberty and the pursuit of happiness
  Trump has made more than $1 billion from crypto in a year. How?
  Goldman Sachs Flags 3 Key Risks Ahead of Europe’s Earnings Season
  JPMorgan Cuts Gold Price Forecast, Sees Bullion Reaching $4,500 by End of 2026
  Elon Musk is remaking the world, like Henry Ford before him – but more dangerously


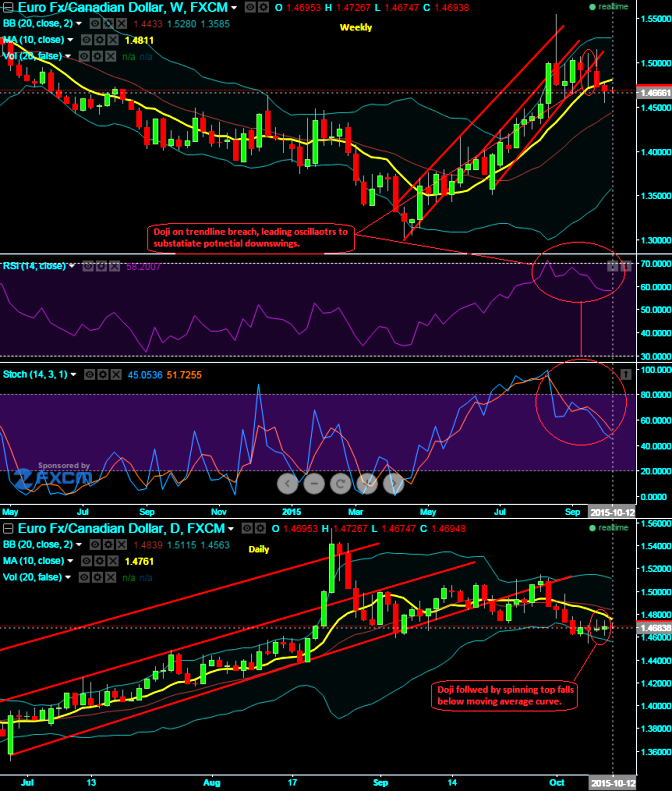
On both weekly and daily charts of EURCAD we spot out Doji pattern candles formed to highlight a caution for bulls. As you can observe Doji on weekly charts has occurred exactly on a trendline breach at around 1.4909 levels which is to be considered as a caution of previous of upswings. On daily chart, again a sharp Doji is formed at 1.4674 levels followed by a spinning top candle has formed to fall below moving average curve.
In addition to that leading oscillators are showing convergence with the price dips on weekly chart. RSI (14) looks healthily converging with every price declines at 58.3084; it has been showing the same indication right from overbought territory. So, RSI signifies the prevailing down streaks may sustain for some slumps.
While another leading oscillator (slow stochastic) hints us the overbought heaviness through %D crossover above 80 levels which overbought zone though the bulls don't seem to lose rallies built by healthy volumes.
Hence, the trading recommendation would be good to buy binary puts on every rally for targets at 20-30 pips.

- News

- Economy

- Central Banks
- Investing
- Research
- Roundups
- Digital Currency
- Insights
- Technical Analysis
- Technology
- Business
- Law
- Health
- Nature
- Fintech
- Science
- Topic
- Opinions
- ©Econometrics LLC . All Rights Reserved.
FxWirePro: Doji on trendline breach hints EUR/CAD bearish sentiments – expect further slumps
Monday, October 12, 2015 8:11 AM UTC
Editor's Picks


- Market Data
Most Popular


