


The dollar has been losing its strength from the last couple of days against a basket of six other major currency peers, as you could probably make out from the US dollar index dipping below 100.110 levels, not far from the recent lows of 99.84, its lowest level since November 15.
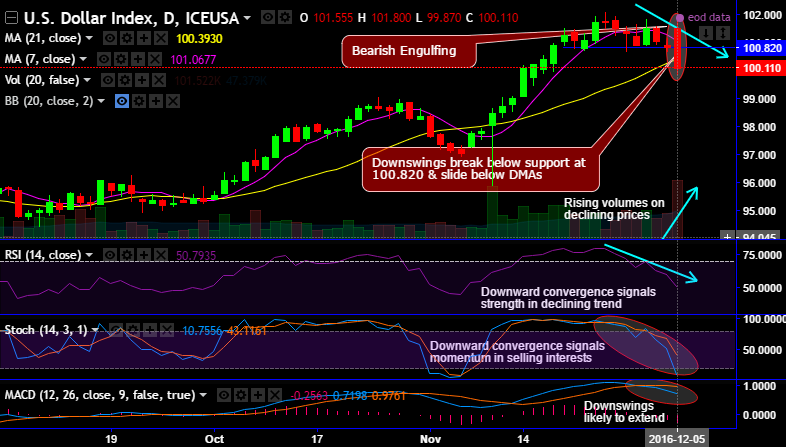
Today’s weakness in the dollar may form a bearish candle pattern, we traced out Bearish Engulfing candle pattern at 100.110 levels.
Consequently, the bears in this downswing have managed to break below support at 100.820 & also slide below DMAs. We could only see next strong support at 99.760 levels.
But on the contrary, please remember the major trend of the dollar has been undoubtedly bullish.
Rising volumes build ups on declining prices would confirm to the downtrend that has been begun since 24th Nov, please be observed that the prices have declined from the highs of 102.120 to the current 100.110 levels.
RSI on daily terms evidences the downward convergence to these price declines that signals the strength in the bearish rout.
Stochastic curves signal extremely intensified momentum in selling interests as you could observe the clear %D crossover right from the overbought territory.
To substantiate this short term bearish rout, one more lagging indicator (MACD) also signals ongoing downswings are likely to extend further as there bearish crossover.
FxWirePro currency strength index that measures the performance of a particular currency against a basket of other seven currencies on an hourly basis also signifies the dollar’s weakness by flashing up with negative numbers.
Check here for more details on the index, please refer below weblink:


