


 AUDJPY Soars Past 112 on BOJ Rate Hike, Technicals Signal Bullish Momentum
  FxWirePro: GBP/USD falls after BoE holds rates and warns of further hikes
  FxWirePro: NZD/USD edges lower, remains on back foot
  FxWirePro: EUR/AUD downside pressure builds, key support level in focus
  FxWirePro- Major Crypto levels and bias summary
  Bitcoin Dips Below $76,000 Amidst ETF Outflows and Technical Signals
  AUDJPY: Bearish Bias Persists Despite Pullback; Sell on Rallies Near 110.78-80 Resistance
  FxWirePro: NZD/USD gains on GDP beat,but downside trend holds
  EURJPY Recovers Over 150 Pips Post-BOJ Hike, Bullish Trend Strengthens
  FxWirePro: GBP/AUD edges lower after Fed 25Bp hike, focus shifts to Thursday BoE
  FxWirePro: AUD/USD gains some ground but outlook is bearish


 Add as a preferred source on Google
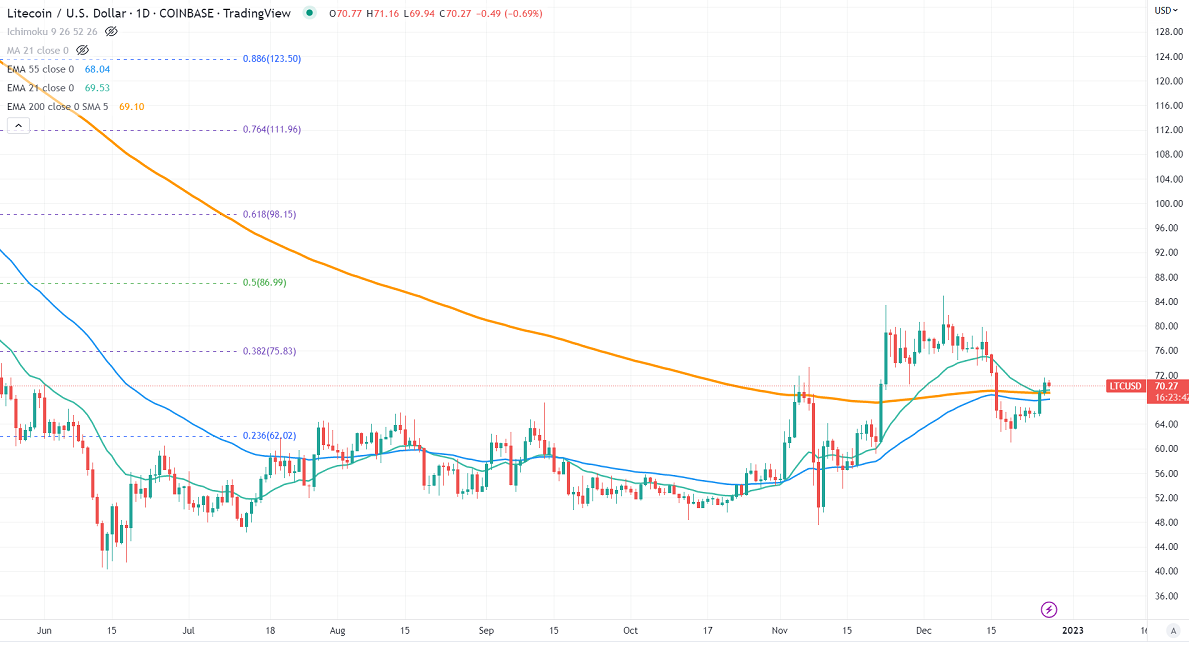
LTCUSD was one of the top performers in the past two days and surged more than 10% with a good uptick in volumes. The pair lost more than $100 from this year's high of $153.91 on board-based crypto markets selling. It hits a high of $84.97 and is currently trading around $70.23.
In the daily chart, the pair is holding above short-term (21 and 55-day EMA) and long-term 200 EMA ($69.09).
The bearish invalidation can happen if the pair closes above $85. On the lower side, the near-term support is $1625 (200-W EMA). Any weekly close below targets $1168 (200-W MA).
The immediate resistance stands at around $85. Any breach above confirms a minor pullback. A jump to $98/$112/$134 is possible. A surge past $153.91 (this year's high) will take Litecoin to the Nov 2021 high of $302.
It is good to buy on dips around $55-56 with SL around $40 for TP of $98.







