


 FxWirePro: USD/ZAR retreats but trend is still bullish
  FxWirePro- Woodies pivot (Major)
  FxWirePro: EUR/NZD up trend gains momentum but hurdles ahead
  FxWirePro : USD/JPY holds relatively bid on 163 ahead Of FOMC,BoJ meetings
  FxWirePro: USD/CAD gaining momentum for a move towards 1.4200 level
  NZDJPY Pullback: Sell Rallies Toward 93.30 as Yen Weakness Eases
  Major Pairs Action Bias: USDCAD and USDCHF Stand Out as Extremely Bullish While GBPUSD and NZDUSD Turn Extremely Bearish
  FxWirePro: GBP/AUD downside pressure builds, key support level in focus
  FxWirePro: EUR/AUD outlook weaker on renewed downside pressure
  Crypto Action Bias: ETHUSD Stands Out as the Bullish Pair to Watch
  NZDJPY Action Bias: Bullish Dip-Buying Opportunity on Broad Yen Weakness
  JPY Action Bias: USDJPY Emerges as the Clear Bullish Pair to Watch Amid Mixed Crosses
  FxWirePro: AUD/USD dips after RBA Governor speech
  EUR/USD Bounces from Monthly Low, But Bearish Pressure Remains
  FxWirePro- Woodies pivot (Major)


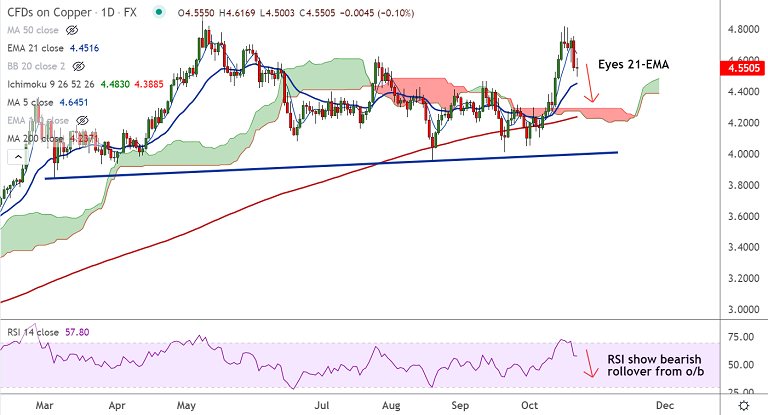
COPPER chart - Trading View
Technical Analysis: Bias Bearish
- Copper was trading 0.22% lower on the day at 4.5473 at around 13:00 GMT
- Price action is extending previous session's slump, more weakness on cards
- RSI shows bearish rollover from overbought levels
- 5-DMA has turned, the pair has slipped below 200H MA
- GMMA indicator has shown a bearish shift on the intraday charts
Support levels - 4.451 (21-EMA), 4.388 (20-DMA), 4.362 (55-EMA)
Resistance levels - 4.597 (200H MA), 4.643 (5-DMA), 4.809 (Upper BB)
Summary: Copper poised for more weakness. Dip till 21-EMA likely. Breach below to see more downside.


