


Refer USD/JPY chart on Trading View
- USD/JPY is trading 0.11% higher on the day, holds above 110 handle at 110.42 at the time of writing.
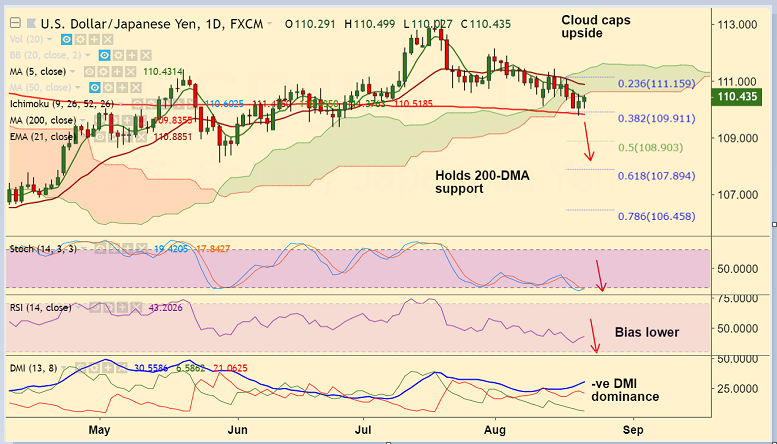
- The pair has bounced off 200-DMA support and is extending upside for the 2 straight session.
- Upside is likely capped at daily cloud and only decisive break above could see extension of gains.
- Technical indicators are biased bearish. RSI and Stochs are sharply lower. We see -ve DMI dominance and ADX is also rising in support of downtrend.
- Break below 38.2% Fib finds next major support at 200-DMA at 109.83. Violation at 200-DMA to see further weakness.
- On the flipside, 21-EMA at 110.88 is immediate resistance. Break above cloud could negate the bearish bias.
Support levels - 109.91 (38.2% Fib), 109.83 (200-DMA), 109.37 (June 25/26 low), 108.90 (50% Fib)
Resistance levels - 110.51 (cloud base), 110.88 (21-EMA), 111.15 (23.6% Fib)
Recommendation: Watch out for break below 200-DMA for further weakness. Target 109.40/ 109/ 108.90.
FxWirePro Currency Strength Index: FxWirePro's Hourly USD Spot Index was at -86.1465 (Bearish), while Hourly JPY Spot Index was at -25.031 (Neutral) at 0645 GMT. For more details on FxWirePro's Currency Strength Index, visit http://www.fxwirepro.com/currencyindex.


