


 FxWirePro- Major Pair levels and bias summary
  NZDJPY Pullback: Sell Rallies Toward 93.30 as Yen Weakness Eases
  FxWirePro: USD/CAD gaining momentum for a move towards 1.4200 level
  FxWirePro: USD/ZAR retreats but trend is still bullish
  FxWirePro: AUD/USD dips after RBA Governor speech
  FxWirePro: USD/CAD runs out of steam but maintains bullish outlook
  FxWirePro: GBP/NZD gains some ground but bias is still bearish
  FxWirePro: USD/ZAR uptrend loses steam, remains on bullish path
  FxWirePro- Woodies pivot (Major)
  FxWirePro: NZD/USD edges lower, remains on back foot
  FxWirePro- Major Pair levels and bias summary
  FxWirePro: GBP/USD edges higher as traders await BoE guidance and UK fiscal clarity
  FxWirePro- Major Crypto levels and bias summary
  FxWirePro- Woodies pivot (Major)
  FxWirePro: EUR/ AUD gains some ground , but remains on bearish path
  FxWirePro: EUR/NZD up trend gains momentum but hurdles ahead


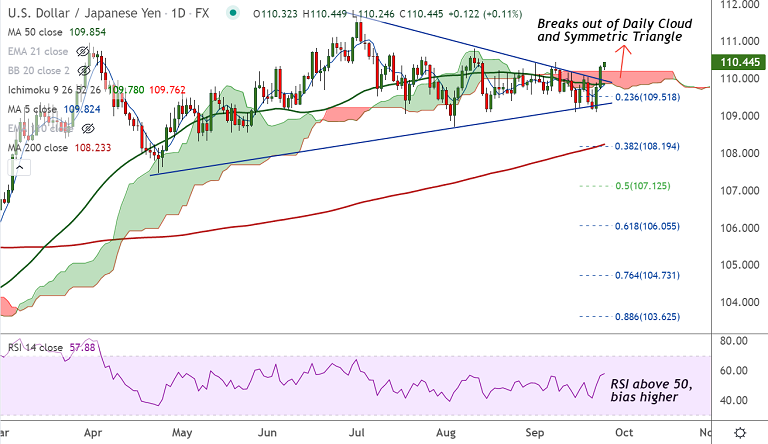
USD/JPY chart - Trading View
Technical Analysis: Bias Bullish
- USD/JPY closes above 'Symmetric Triangle' top and daily cloud
- Momentum is bullish, Stochs and RSI are biased higher
- Volatility is high and rising as evidenced by widening Bollinger bands
- GMMA indicator shows minor trend is turning bullish on the daily charts
Support levels - 110.19 (Cloud top), 109.95 (Trendline), 109.85 (50-DMA)
Resistance levels - 110.80 (Aug 11 high), 110.90 (Upper W BB), 111.65 (July high)
Summary: After grinding sideways above 21-week EMA, USD/JPY is set to have resumed upside momentum. Breakout at Symmetric Triangle and Daily Cloud reinforces upside bias in the pair. Scope for test of 111.65 (July highs). Bullish invalidation only below cloud.







