


 FxWirePro- Major Crypto levels and bias summary
  Bitcoin Cracks $75K as $1.3B ETF Exodus and Middle East Jitters Spook Bulls; Bears Eye $70K
  FxWirePro- Major Crypto levels and bias summary
  Ethereum Tumbles Below $2K: Bears Eye $1,700 as All Key EMAs Flip Red
  ETH Cracks $2,100 in Bitcoin’s Wake as Bearish EMA Stack Deepens; Sellers Target $1,900 on Rallies
  Bitcoin Bleeds $704M in ETF Outflows as Institutional Exodus Accelerates


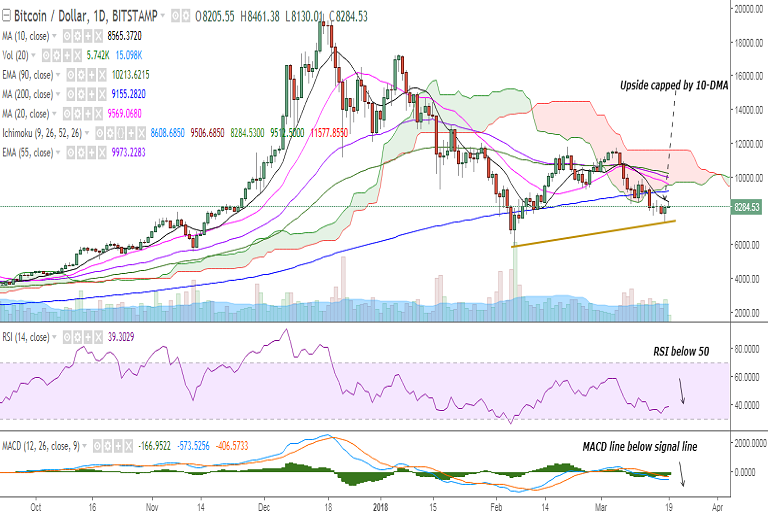
BTC/USD dropped to 7325 levels on March 18 before closing at 8188 levels. It is currently trading at 8300 levels at the time of writing (Bitstamp).
On the topside, the pair is likely to face resistance at 8564 (10-DMA) and a break above would see it testing 8978 (4h 90-EMA)/9155 (200-DMA). Further strength would target 9512 (Cloud bottom)/9921 (4h 200-SMA)/10213 (90-EMA).
On the down side, support is seen at 8063 (1h 100-SMA) and a break below would target 7759 (161.8% retracement of 9260 and 116888)/7500. Further weakness would drag it to 7360 (trend line joining 5920 and 7325)/7000/6544 (78.6% retracement of 2972.01 and 19666)/6460 (1w 50-SMA).
Momentum studies: Bias appears bearish on the daily chart with the pair’s upside capped by 10-DMA, RSI at 39, and MACD line below the signal line. However, stochs appear to be on the verge of a rollover from the oversold levels. A decisive break above 10-DMA could see minor bullishness in the pair.
Intraday bias appears bullish and a jump till 8564 (1h 200-SMA) could be on the cards.
However, bias remains bearish on the weekly chart with RSI below 50, MACD line below the signal line and stochs near oversold levels.
FxWirePro launches Absolute Return Managed Program. For more details, visit http://www.fxwirepro.com/invest

- News

- Economy

- Central Banks
- Investing
- Research
- Roundups
- Digital Currency
- Insights
- Technical Analysis
- Technology
- Business
- Law
- Health
- Nature
- Fintech
- Science
- Topic
- Opinions
- ©Econometrics LLC . All Rights Reserved.
FxWirePro: BTC/USD upside capped by 10-DMA, break below trend line support at 7360 to see further downside
Monday, March 19, 2018 6:53 AM UTC
Editor's Picks


- Market Data
Most Popular


