


 FxWirePro- Major Crypto levels and bias summary


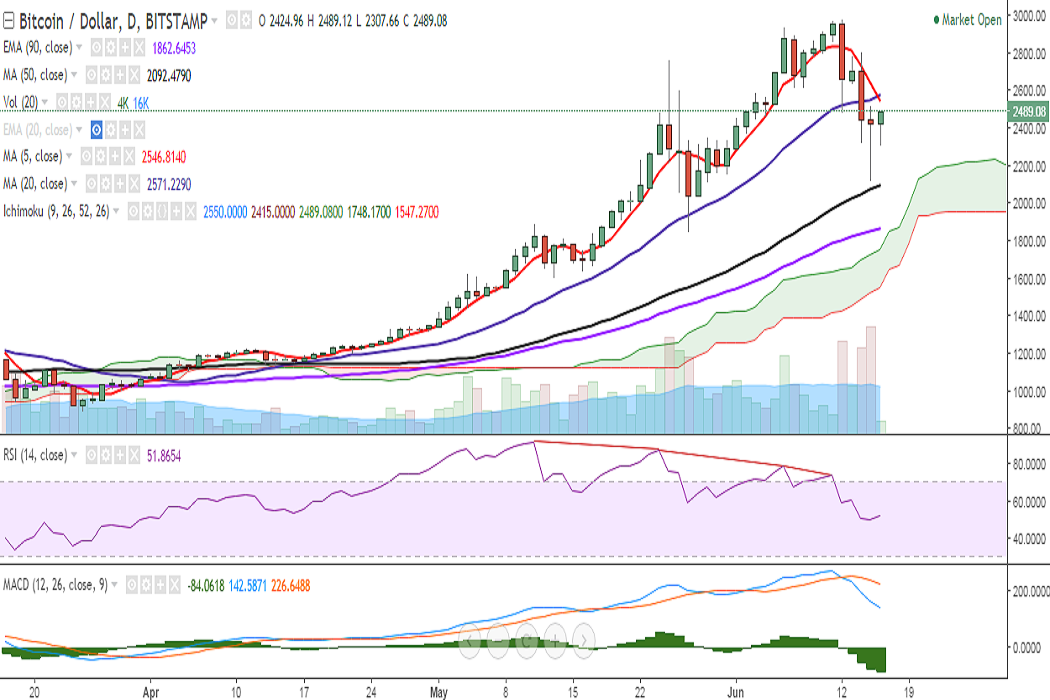
BTC/USD plunged to 2120 levels on Thursday, before closing at 2424 levels. It is currently trading at 2488 levels at the time of writing (Bitstamp).
Ichimoku analysis of daily chart:
Tenkan Sen: 2550
Kijun Sen: 2415
On the upside, the pair will run into resistance at 2569 (20-DMA) and a break above would signify a trend reversal. Consistent move upwards would then see it testing 2651 (61.8% retracement of 2980 and 2120)/2687 (10-DMA)/2795.
Support is seen at 2381 (2h 20-SMA) and any violation would drag it to 2352 (4h 200-SMA)/2263 (61.8% retracement of 1850 and 2933). Further weakness would target 2120 (June 15 low)/2091 (78.6% retracement of 1850 and 2980)/1850 (May 27 low).
Momentum studies: On the daily chart, RSI is at 51; MACD line is below the signal line, and stochs suggest lower bias. Also, 5- and 20-DMA are on the verge of a bearish crossover.
On the 2-hour chart, the death cross suggests further downside possibility. The pair would run into resistance at 2582 (2h 50-SMA).
On the weekly chart, the pair is trading just above 5-SMA and RSI is at 71 and a rollover from the overbought zone would confirm further downside.
Call Update: The pair surpassed our previous call and has hit 2120 levels on Thursday.
Recommendation: Watch out for a break below 50-DMA for further downside.


