


 FxWirePro- Major Crypto levels and bias summary
  FxWirePro- Major Crypto levels and bias summary


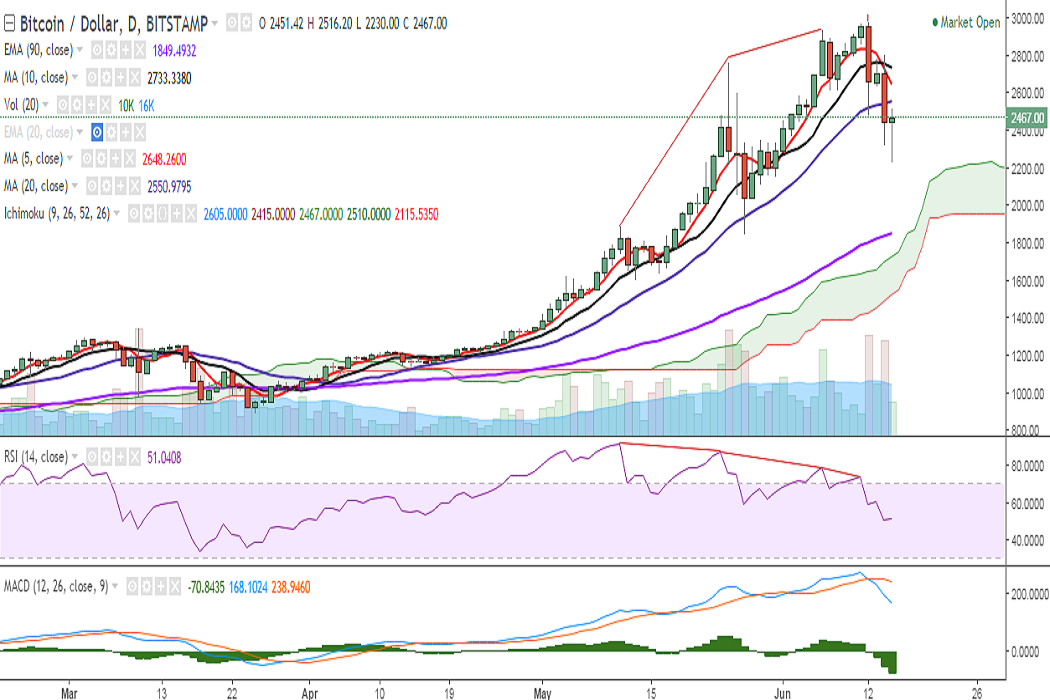
BTC/USD traded deep in the red as it broke below major support at 20-DMA on Wednesday. It continued its downtrend today, falling to 2230 levels, before restoring strength to 2407 levels where it currently trades (Bitstamp).
Ichimoku analysis of daily chart:
Tenkan Sen: 2605
Kijun Sen: 2415
On the upside, the pair will run into resistance at 2475 (2h 10-SMA) and a break above would see it testing 2548 (20-DMA)/2637 (5-DMA)/2728 (10-DMA).
Support is seen at 2333 (4h 200-SMA) and any violation would drag it to 2263 (61.8% retracement of 1850 and 2933)/2091 (78.6% retracement of 1850 and 2980)/1850 (May 27 low).
Momentum studies have turned bearish: On the daily chart, RSI is at 50, bias lower; MACD line is below the signal line, and stochs suggest lower bias. Also, the bearish crossover of 5- and 10-DMA suggests a further possibility for a downtrend.
Call Update: The pair surpassed our previous call and has hit 2230 levels so far in the day
Recommendation: The bias is still bearish, and traders are preferred to stay short. Some upside could be seen on the hourly charts which could be considered as an opportunity to go short.
Good to go short around 2470/2480. SL: 2550. TP: 2333/2230.


