


 FxWirePro- Major Crypto levels and bias summary


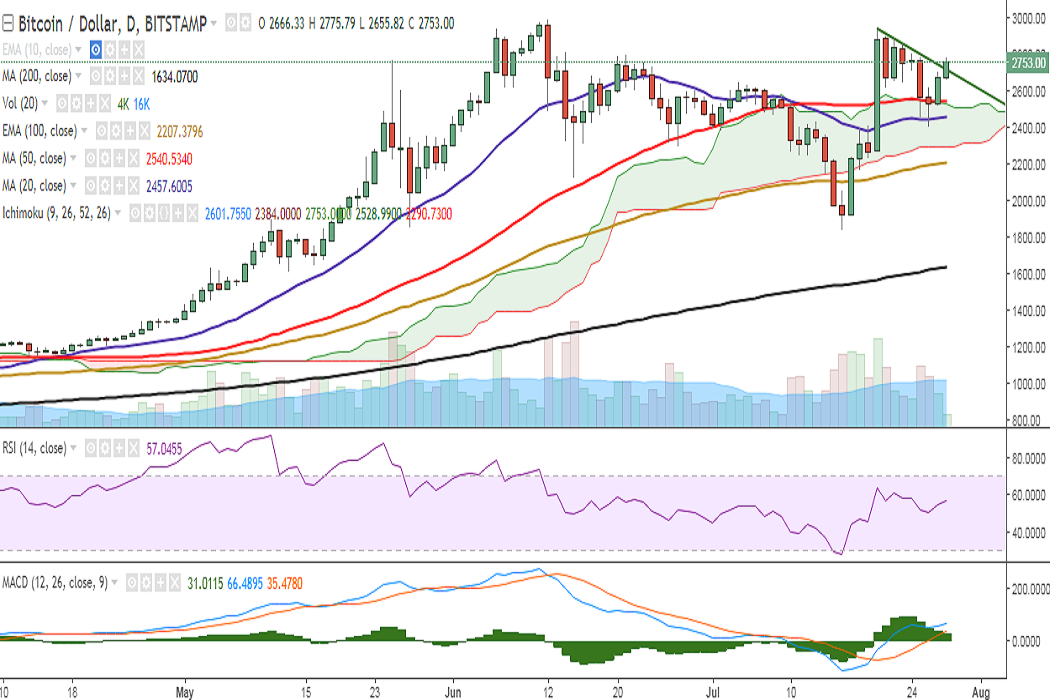
BTC/USD broke above trend line resistance on Friday and is trading at 2766 at the time of writing (Bitstamp).
Ichimoku analysis of daily chart:
Tenkan Sen: 2601.75
Kijun Sen: 2384
The pair is currently hovering around 2760 levels (May 25 high) and further strength would see it testing 2795 (78.6% retracement of 2980 and 2120)/2938 (July 20 high). Further uptrend would target 2980 (June 12 high)/3091.
On the reverse side, support is seen at 2676 (23.6% retracement of 1830 and 2938) and any violation would drag it to 2651 (5-DMA)/2540 (50-DMA). Further weakness would target 2457 (20-DMA)/2430 (55-EMA)/2384/2290 (Cloud bottom).
Momentum studies: Overall trend appears bullish with RSI strong at 57, stochs biased higher, and MACD line above the signal line on the daily chart. Bias appears bullish on the hourly charts as well.
Recommendation: Good to go long on dips around 2725. SL: 2600. TP: 2800/2850/2938.
FxWirePro launches Absolute Return Managed Program. For more details, visit http://www.fxwirepro.com/invest

- News

- Economy

- Central Banks
- Investing
- Research
- Roundups
- Digital Currency
- Insights
- Technical Analysis
- Technology
- Business
- Law
- Health
- Nature
- Fintech
- Science
- Topic
- Opinions
- ©Econometrics LLC . All Rights Reserved.
FxWirePro: BTC/USD breaches strong trend line resistance at 2714, good to go long on dips
Friday, July 28, 2017 9:33 AM UTC
Editor's Picks


- Market Data
Most Popular


