


 Ethereum Cracks Under $1,700: Sell the Rally Near $1,750 as Bears Eye $1,380–$1,200
  FxWirePro- Major Crypto levels and bias summary


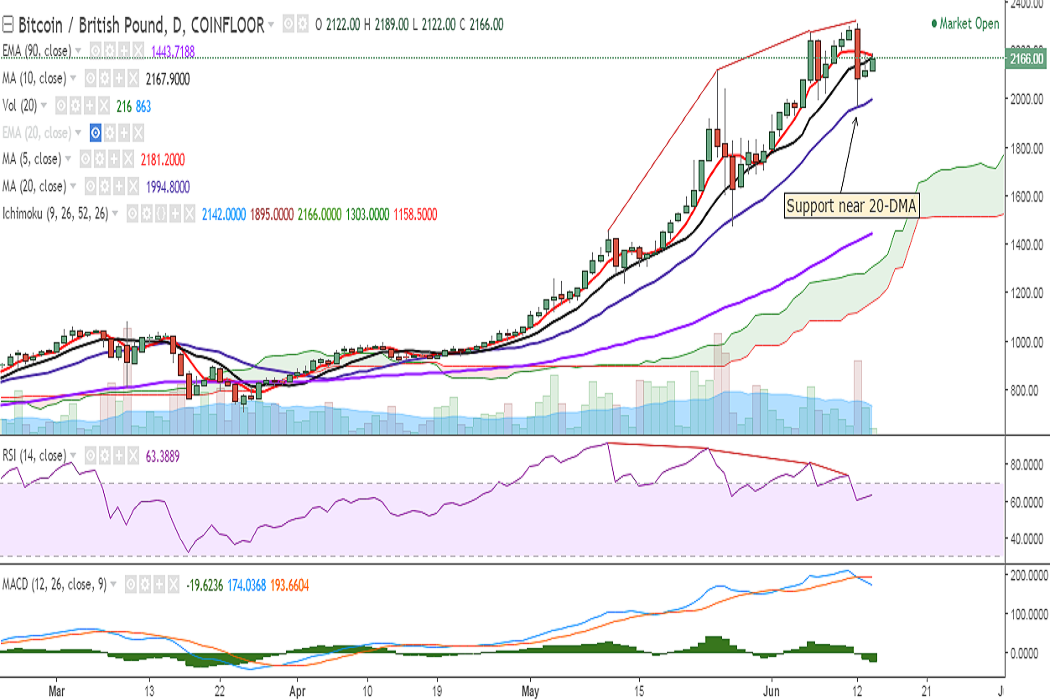
BTC/GBP failed to break above 5-DMA on Tuesday and is currently trading at 2147 levels at the time of writing (Coinfloor).
Ichimoku analysis of daily chart:
Tenkan Sen: 2142
Kijun Sen: 1895
On the upside, the pair faces resistance at 2181 levels (5-DMA) and a consistent break above would see it testing 2277 (June 06 high)/2292 (127.2% retracement of 2118 and 1475). Further strength would take it to 2315 (June 12 high)/2381 (113% extension of 1475 and 2277).
Support is seen at 2067 (4h 90-EMA) and a break below will drag it to 1969 levels (June 12 low)/1876 (50% retracement of 1475 and 2277)/1781.
Momentum studies: RSI is strong at 63, however, multiple bearish divergences could be seen on the daily chart. Stochs have rolled over from the overbought zone and MACD line has crossed the signal line from above.
On the hourly chart, the pair’s upside is capped by 2193 (1h 200-SMA) and only a close above will see further bullishness.

- News

- Economy

- Central Banks
- Investing
- Research
- Roundups
- Digital Currency
- Insights
- Technical Analysis
- Technology
- Business
- Law
- Health
- Nature
- Fintech
- Science
- Topic
- Opinions
- ©Econometrics LLC . All Rights Reserved.
FxWirePro: BTC/GBP upside capped by 5-DMA, further bullishness only on close above
Wednesday, June 14, 2017 11:03 AM UTC
Editor's Picks


- Market Data
Most Popular


