


 BTC’s Bear Bounce: Sell the Rally Near $66K as Bears Target $59K–$52K Breakdown


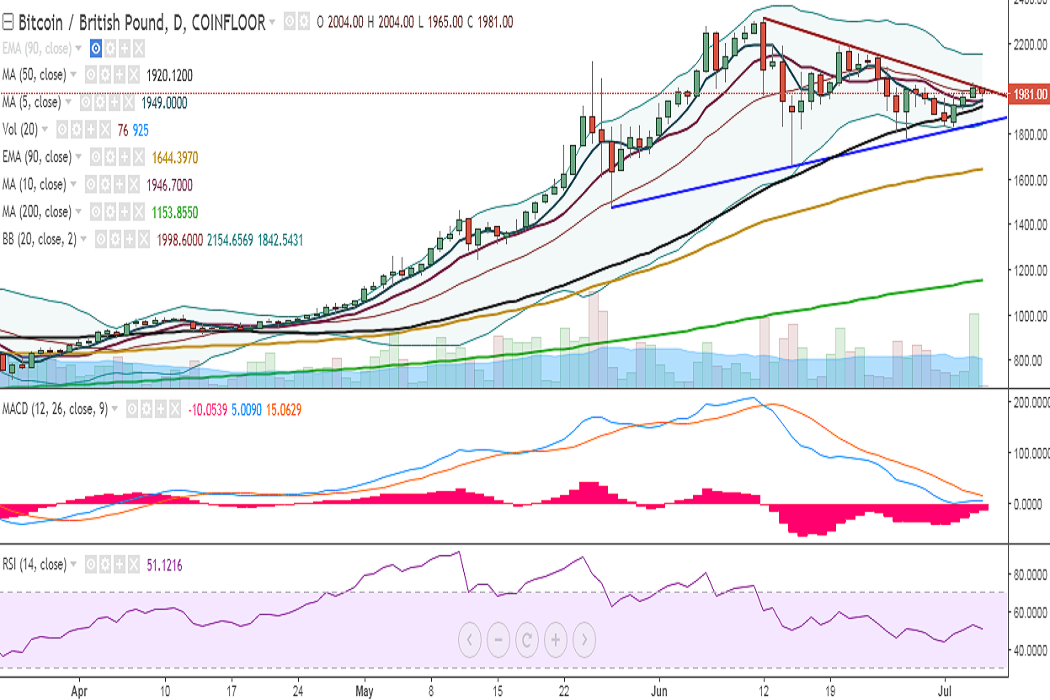
BTC/GBP is struggling to break above the trend line joining 2315 and 2193 and continues to hover around that level. It is currently trading at 1984 levels at the time of writing (Coinfloor).
Ichimoku analysis of daily chart:
Tenkan Sen: 1901.50
Kijun Sen: 1986
On the upside, a consistent break above 2003 (trend line joining 2315 and 2193) would see the pair testing 2063 (61.8% retracement of 2315 and 1657)/2118 (May 25 high). Further strength would target 2193 (June 21 high)/2247 (113% retracement of 2193 and 1777).
On the flipside, support is likely to be found at 1946 (10-DMA) and any violation would drag it to 1920 (50-DMA)/1851 (trend line joining 1475 and 1657). Further weakness would target 1830 (July 02 low)/ 1777 (June 27 low).
Momentum studies: On the daily chart, RSI is at 51 and MACD line is below the signal line with fading downward momentum. However, stochs are biased higher.
Recommendation: Wait for clear directional bias.
FxWirePro launches Absolute Return Managed Program. For more details, visit http://www.fxwirepro.com/invest

- News

- Economy

- Central Banks
- Investing
- Research
- Roundups
- Digital Currency
- Insights
- Technical Analysis
- Technology
- Business
- Law
- Health
- Nature
- Fintech
- Science
- Topic
- Opinions
- ©Econometrics LLC . All Rights Reserved.
FxWirePro: BTC/GBP faces stiff trend line resistance at 2003, bias neutral
Wednesday, July 5, 2017 9:37 AM UTC
Editor's Picks


- Market Data
Most Popular


