


 Major Crypto Action Bias: BTC, ETH & SOL Turn Bullish – SOLUSD Leads as the Top Pair to Watch
  Crypto Bias Report: Trend Signals and Top Bullish Picks
  FxWirePro- Major Crypto levels and bias summary
  FxWirePro- Major Crypto levels and bias summary


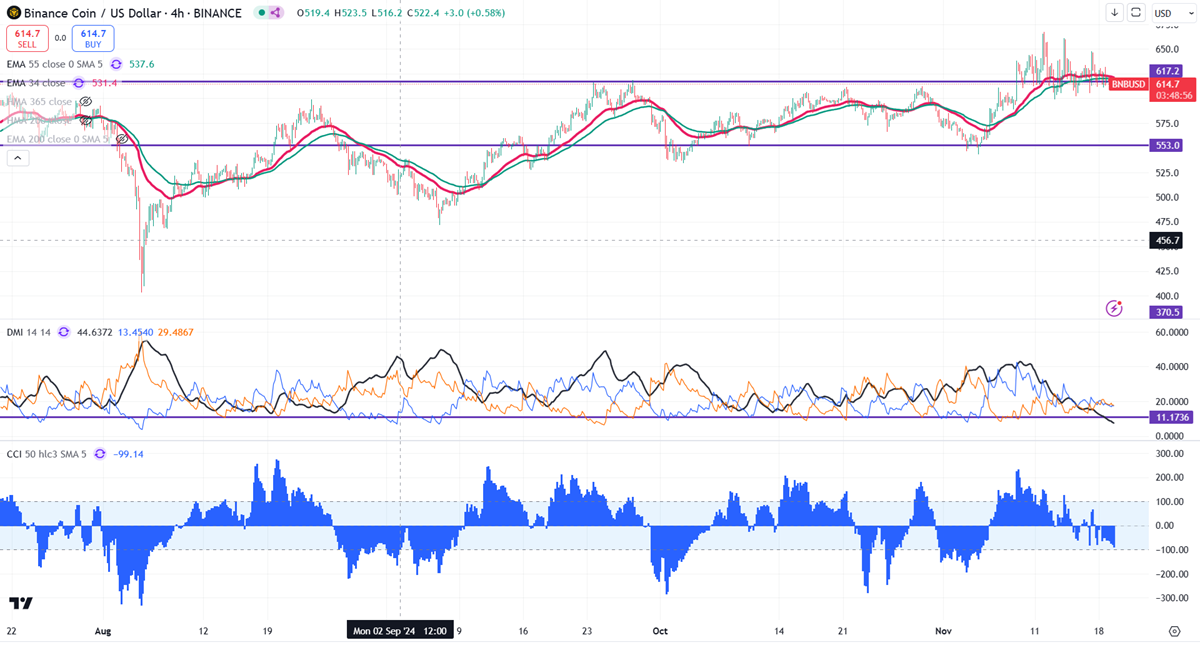
Key Level to Monitor: $545
The BNB/USD pair is trading in a narrow range of $647 and $602 for the past four days. It is currently trading at around $614.50. A closing price above $670 confirms further bullishness.
Intraday bias remains bullish as long as support $585 holds. It trades below the 34 and 55 EMA on the 4-hour chart. If the pair closes below $600, potentially leading to further declines towards $585/ $559,$545, $528, $500, and possibly down to $470.
Immediate Resistance is at $670. A successful breakout above this resistance could suggest bullish momentum, with further gains possible towards $700/$725.
Indicators (4-Hour Chart)
- Directional Movement Index: Neutral
- CCI (50): Bearish
Trading Strategy
Consider buying on dips around $600, with a stop-loss set at $550 and a target price of $700/$725.


