


 FxWirePro: GBP/USD stays below 1.3400 level following cooler inflation report
  FxWirePro: USD/CAD retreats slightly but trend is still bullish
  JPY Strength Alert: USDJPY, AUDJPY, EURJPY and CADJPY Turn Extremely Bullish
  FxWirePro: USD/CAD edges lower but bullish outlook persists
  FxWirePro: GBP/NZD gains some upside momentum but still bearish
  Bitcoin Holds Above $65K as Institutional Inflows Resume; Buy Dips Near $64K
  FxWirePro: EUR/ AUD downtrend loses steam, remains on bearish path
  FxWirePro: EUR/AUD neutral in the near term, scope for downward resumption
  FxWirePro: AUD/USD rallies on jobs surge, heads to test key resistance
  FxWirePro: USD/CNY attracts selling interest, vulnerable to more downside
  FxWirePro: EUR/NZD firms after ECB holds rates steady at 2.25%
  FxWirePro- Major Pair levels and bias summary
  Major Crypto Action Bias: ETHUSD Turns Bullish – Only Bullish Pair to Watch


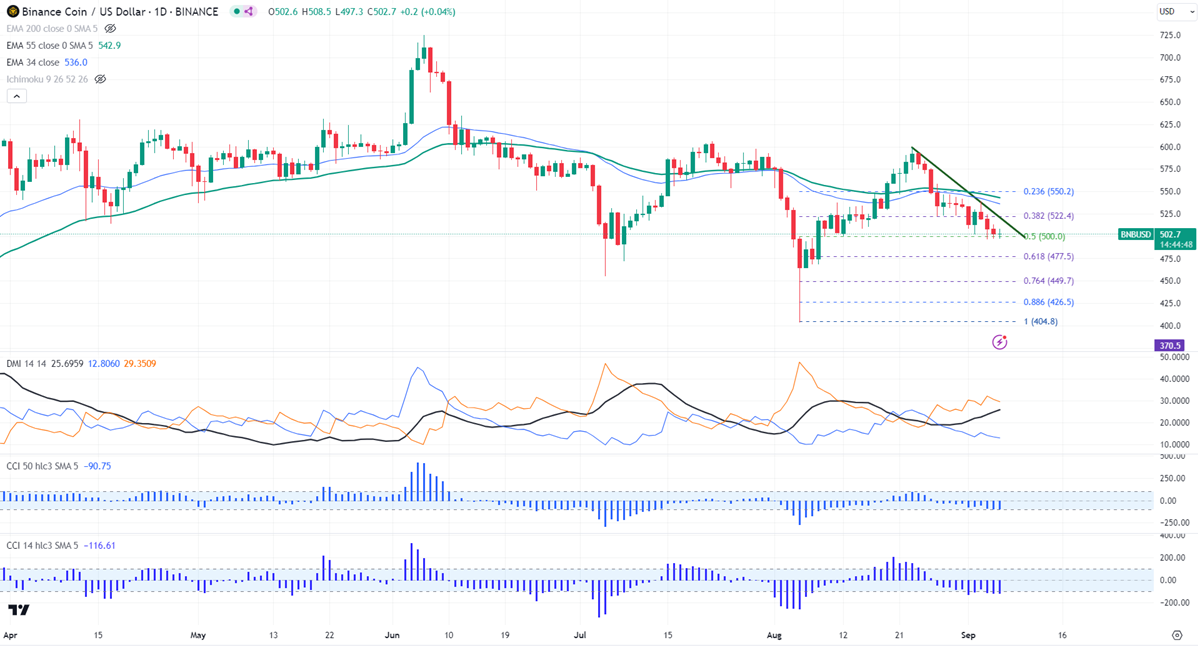
Intraday bias - nEUTRAL
Horizontal trend line- $605
Any close above $555 confirms intraday bullishness.
BNBUSD trades in a narrow range between $496 and $513 for the past three days. The pair was one of the worst performers in the past two weeks and lost nearly $80. It hit a low of $497 at the time of writing and is currently trading around $502.60.
The intraday bearish trend continuation can happen if the pair breaks $490. On the lower side, the near-term support is $490. Any break below targets $477/$450/$403 is possible.
The immediate resistance stands at around $520.10 (200-day EMA). Any breach above confirms minor bullishness. A jump to $541/$553 is possible. Bullish continuation only if it breaks $553. A surge past $553 will take it to $605/$700.
Indicators ( Daily chart)
Directional movement index -Bearish
CCI (50)- Bearish
CCI(14)- Bearish
It is good to buy above $553 with SL around $519 for TP of $700.


