


 EURJPY Bullish Bias Holds Strong: Buy the 184.80 Dip Toward 187
  USD/CHF Surges on Broad Dollar Buying, Eyes 0.8200 Next
  FxWirePro: GBP/NZD slips as Middle East tensions fuel risk aversion
  NZDJPY Smashes 4-Month High on Kiwi Buying Frenzy – Bullish Setup Remains Strong
  GBPJPY Bullish Bias Stays Strong: Buy the 217 Dip, Target 220
  FxWirePro :USD/JPY hovers near 40-year high, bias bullish
  AUDJPY Range Traps Bulls: Sell Rallies at 112.60, Target 110
  EUR/JPY Poised to Slide — Sell Rallies into 185.30 with Eye on 183"
  GBPJPY Stuck in Tight Range – Neutral Bias Persists Despite Bullish EMAs
  ETHUSD Bullish Momentum: Follows BTC Above All EMAs, Buy Dips Near $1750 Targeting $2300


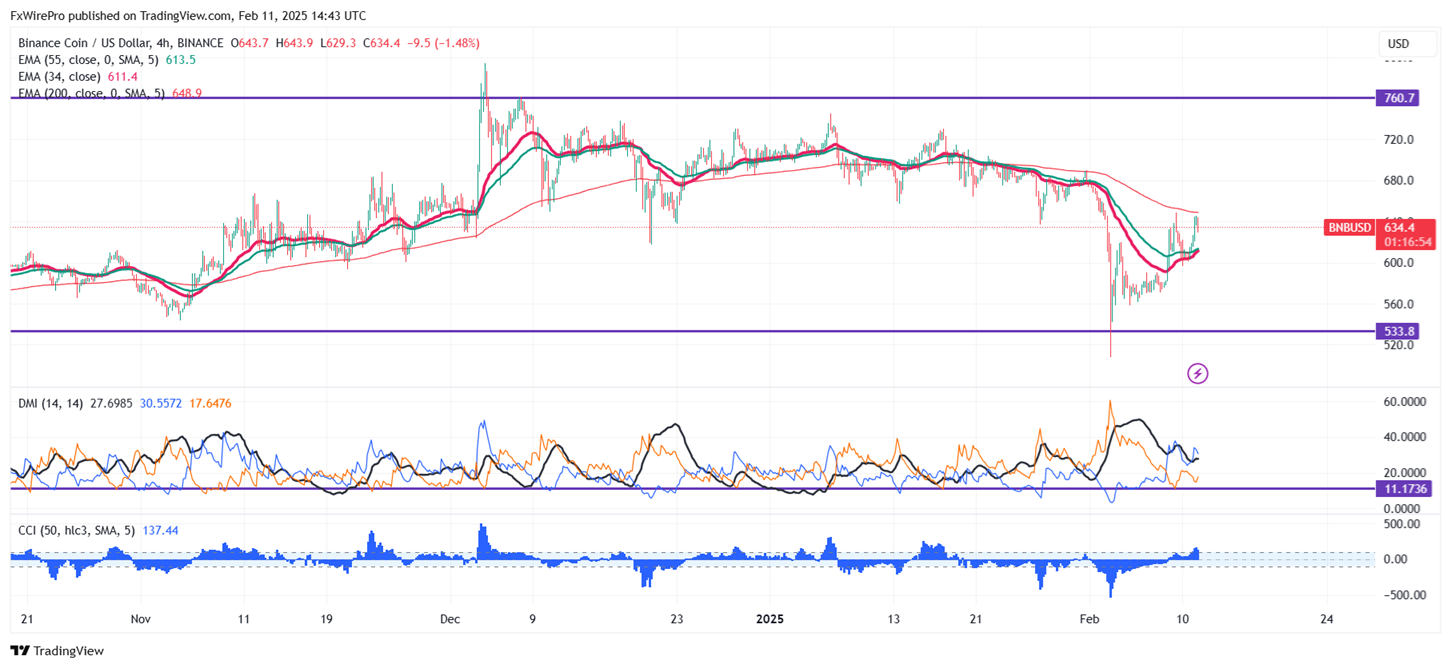
Key Level to Monitor: $660
BNB/USD pair showed a minor pullback after forming a minor bottom around $596. It hit an intraday high of $645 and is currently trading around $642.
Overall bias remains bullish as long as support of $500 holds. It trades above the 34 and 55 EMA on the 4-hour chart. If the pair closes below $590, potentially leading to further declines towards $580/$550/$500.
Immediate Resistance is at $660. A successful breakout above this resistance could suggest bullish momentum, with further gains possible towards $700/$725/$775/$812/$848/$1000.
Indicators (4-Hour Chart)
- Directional Movement Index: Bullish
- CCI (50): Bullish
Trading Strategy
Consider buying on dips around $600 with a stop-loss set at $500 and a target price of $1000.


