


 Energy Sector Outlook 2025: AI's Role and Market Dynamics
  FxWirePro: GBP/AUD steadies around 0.9145 ,retains bid tone
  China’s Growth Faces Structural Challenges Amid Doubts Over Data
  FxWirePro- Major Pair levels and bias summary
  FxWirePro: AUD/USD eases after Australian mixed CPI data
  FxWirePro: USD/CNY hits one –month high, scope for further upside
  Trump’s "Shock and Awe" Agenda: Executive Orders from Day One
  Moody's Upgrades Argentina's Credit Rating Amid Economic Reforms
  FxWirePro: NZD/USD downside pressure builds, key support level in focus
  FxWirePro: EUR/AUD bullish outlook with scope to target 1.6500
  Fed May Resume Rate Hikes: BofA Analysts Outline Key Scenarios
  U.S. Stocks vs. Bonds: Are Diverging Valuations Signaling a Shift?
  FxWirePro- Woodies pivot (Major)
  FxWirePro: USD/ZAR remains buoyant, looks to extend gains
  Gold Prices Slide as Rate Cut Prospects Diminish; Copper Gains on China Stimulus Hopes
  Oil Prices Dip Slightly Amid Focus on Russian Sanctions and U.S. Inflation Data
  Stock Futures Dip as Investors Await Key Payrolls Data


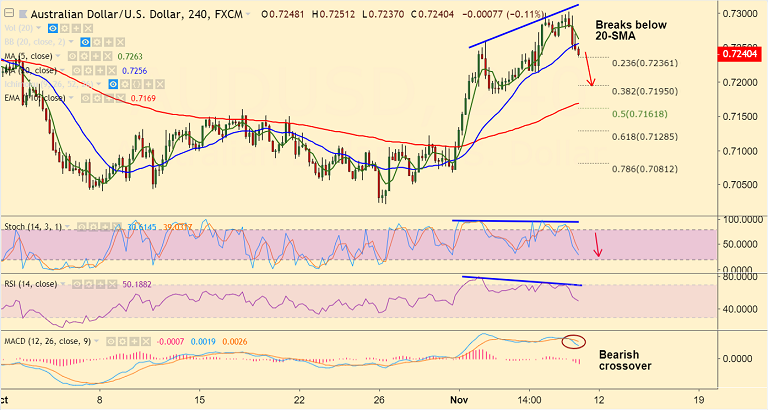
AUD/USD chart on Trading View used for analysis
- Aussie extends weakness on dismal China inflation data and bearish technical setup on intraday charts raises scope for further weakness.
- China's October factory-gate inflation gauge came-in at 3.3 percent, missing estimates at 3.4 percent and down from the previous month's reading of 3.6 percent.
- Also, the Aussie was largely unimpressed by the Reserve Bank of Australia's (RBA) latest Statement of Monetary Policy.
- The RBA maintained their no-movement stance on interest rates or monetary policies in general.
- We see the major has formed a bearish divergence on RSI and Stochs on the 4-hourly charts.
- The pair has slipped below 20-SMA on the 4H chart and has tested 23.6% Fib at 0.7236.
- Stochs and RSI are sharply lower and we see bearish MACD line crossover on signal line which raise scope for further weakness.
Support levels - 0.7195 (38.2% Fib), 0.7169 (4H 110-EMA), 0.7143 (20-DMA)
Resistance levels - 0.7283 (110-EMA), 0.73
Recommendation: Good to go short on upticks around 0.7245/55, SL: 0.7285, TP: 0.72/ 0.7170
For details on FxWirePro's Currency Strength Index, visit http://www.fxwirepro.com/currencyindex.


