


 FxWirePro- Woodies pivot (Major)
  NZDJPY Retreats on Yen Strength – Bearish Setup Targets 90 After Hitting 92.75 Low
  FxWirePro: GBP/AUD bears maintain upper hand
  Major European Indices Score Extremely Bullish: DAX Eyes 26000, CAC Targets 8600, FTSE100 at 11000 – Key Levels to Watch
  FxWirePro- Major Crypto levels and bias summary
  FxWirePro: GBP/USD rises as soft US data pressures dollar
  FxWirePro- Major Pair levels and bias summary
  FxWirePro: NZD/USD consolidates overnight gains, but loses momentum
  FxWirePro: GBP/AUD drifts lower after BOE rate decision
  FxWirePro: GBP/NZD remains weak, eyes 38.2%fib support
  FxWirePro: EUR/ AUD dips below 1.6400 level, focus on near term support
  AUDJPY Volatile After Massive Sell-Off: Sell Rallies at 113, Targeting 110 as Bearish Momentum Surges
  FxWirePro- Woodies pivot (Major)
  AUD/JPY Slips Below 112 as BOJ Intervention Sparks Bearish Momentum: Sell the Rallies
  FxWirePro: AUD/USD gains some ground but outlook is bearish
  Major FX Action Bias & US Market Sentiment: NZD/USD (Extremely Bullish) & AUD/USD (Bullish) Watchlist


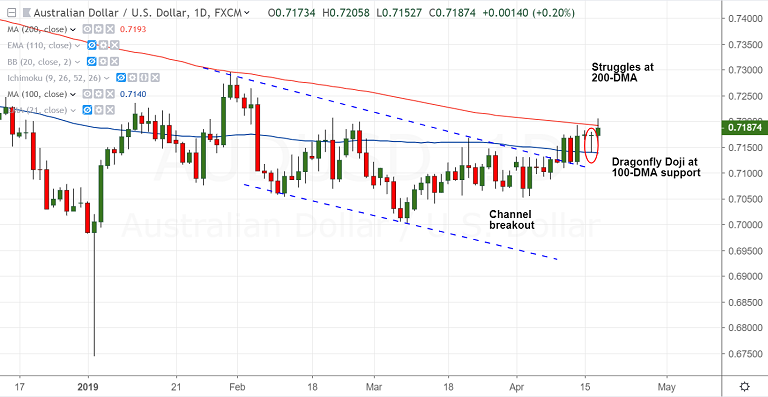
AUD/USD chart - Trading View
- Aussie buoyed in the early Asian session after solid China data dump.
- AUD/USD hit 8-week highs at 0.7206 before trimming some gains to trade at 0.7186 at 0325 GMT.
- Chinese data dump showed a bigger-than-expected jump in the Chinese industrial production figures while the Q1 GDP numbers steadied across the time horizon.
- China's YoY GDP figures for Q1 of 2019 came at +6.4 percent, above expectations at +6.3 percent and compared to +6.4 percent in the previous quarter.
- Industrial output YoY was a big beat on expectations, printing at +8.5 percent against +5.9 percent expected and +5.3 percent last.
- Technical studies have turned slightly bullish, though major trend remains bearish.
- The pair has bounced off 100-DMA with a Dragonfly Doji formation and break above 200-DMA could see further gains. Scope for test of 0.7295 Jan 31 high.
- Strong support seen at 0.7140. Decisive break below will see weakness till 0.7109 (cloud top) and then 0.7087 (Apr 8 low).
Support levels - 0.7140 (100-DMA), 0.7109 (cloud top)
Resistance levels - 0.7193 (200-DMA), 0.7273 (55-W EMA)
For details on FxWirePro's Currency Strength Index, visit http://www.fxwirepro.com/currencyindex.


