


 FxWirePro: USD/JPY eases ahead of Fed decision , Intervention risks linger
  NZD/JPY Flatlines Near 94.60: Will Key Support Reignite the Uptrend?
  EUR/JPY Holds Bullish Bias as Euro Extends Recovery
  FxWirePro: USD/ CNY remains soft ahead of Fed decision
  FxWirePro: GBP/USD edges lower ahead of Fed policy verdict
  FxWirePro: EUR/ AUD gains some ground , but remains on bearish path
  FxWirePro- Woodies pivot (Major)
  FxWirePro: GBP/AUD gains some upside momentum but still bearish
  Major Forex Pairs Action Bias: GBPUSD and AUDUSD Turn Extremely Bearish
  FxWirePro- Woodies pivot (Major)
  FxWirePro- Major Pair levels and bias summary
  FxWirePro: GBP/NZD maintains bersish bias with focus on 2.2900 level
  FxWirePro: AUD/USD falls after softer-than-expected Australian Q2 CPI
  FxWirePro: USD/CAD runs out of steam but maintains bullish outlook


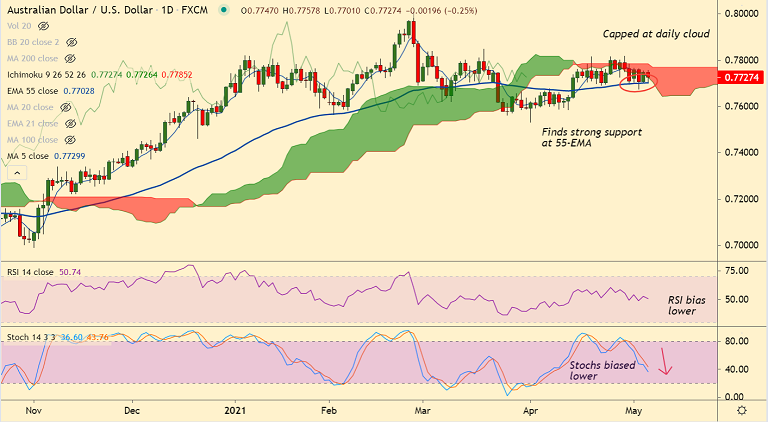
AUD/USD chart - Trading View
Technical Analysis: Bias Neutral, tilted towards the downside
GMMA Indicator
- Major and minor trend is neutral on the daily charts
- Weekly charts shows major trend is bullish while minor trend is turning bullish
Ichimoku Analysis
- Cloud caps gains in the pair
- Chikou span is bias lower, supporting downside
Oscillators
- Stochs and RSI are biased lower
- RSI still holds above the 50 mark
Bollinger Bands
- Volatility is high on the daily charts as evidenced by wide Bollinger bands
- Intraday charts show rising volatility which along with bearish momentum could drag prices lower
Major Support Levels: 0.7702 (55-EMA), 0.7634 (21W EMA), 0.7625 (110-EMA)
Major Resistance Levels: 0.7785 (Upper BB), 0.78, 0.7823 (Upper BB)
Summary: Aussie under pressure after China says to end 'strategic economic dialogue' and "indefinitely suspend" all activities under the China-Australia Strategic Economic Dialogue. Sour market sentiment and the US dollar strength exerting additional pressure on the pair.
Technical indicators are biased lower. MACD shows bearish crossover on signal line. Price action is holding support at 55-EMA at 0.7702, break below will drag the pair lower.


