


 FxWirePro: GBP/NZD remains weak, eyes 38.2%fib support
  AUDJPY Volatile After Massive Sell-Off: Sell Rallies at 113, Targeting 110 as Bearish Momentum Surges
  FxWirePro- Major Pair levels and bias summary
  FxWirePro: NZD/USD consolidates overnight gains, but loses momentum
  US Magnificent 7 Stocks Trend Score: Amazon & Microsoft Hit Extreme Bullish (+100) as Meta Drops to -100 — Key Resistance & Support Watchlist
  FxWirePro: GBP/USD rises as soft US data pressures dollar
  FxWirePro- Major Crypto levels and bias summary
  Major FX Action Bias & US Market Sentiment: NZD/USD (Extremely Bullish) & AUD/USD (Bullish) Watchlist
  FxWirePro: GBP/AUD bears maintain upper hand
  FxWirePro: EUR/ AUD dips below 1.6400 level, focus on near term support
  FxWirePro: USD/CNY dips to hit three year low,scope for further downside
  FxWirePro: AUD/USD gains some ground but outlook is bearish
  US Magnificent 7 Stocks Trend Score: Amazon & Microsoft Hit Extreme Bullish (+100) as Meta Drops to -100 — Key Resistance & Support Watchlist
  FxWirePro: USD/CAD retreats after Canada posts stronger-than-expected GDP growth
  AUD/JPY Slips Below 112 as BOJ Intervention Sparks Bearish Momentum: Sell the Rallies
  FxWirePro: GBP/AUD drifts lower after BOE rate decision
  FxWirePro- Woodies pivot (Major)


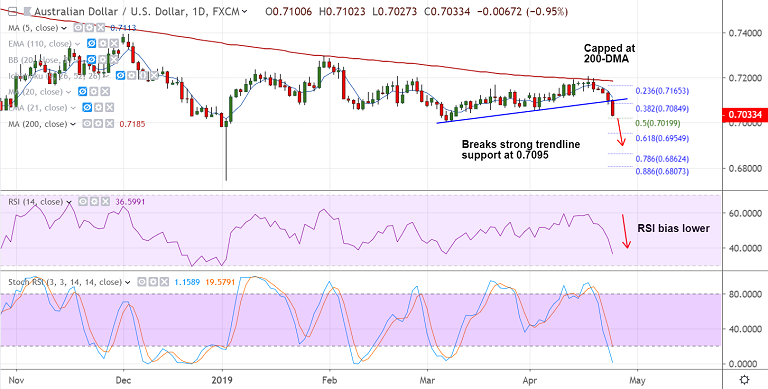
AUD/USD chart - Trading View
- AUD/USD slumps from near 0.71 levels to hit 6-week lows at 0.7026 after poor Australia inflation data.
- Data released earlier today showed Australia Q1 consumer price index, rose 0.3 percent quarter-on-quarter, missing the estimated rise of 0.4 percent.
- Technical indicators support downside in the pair. RSI and Stochs are sharply lower. RSI has edged below the 50 mark.
- Price action has broken strong trendline support at 0.7095, eyes next support at 61.8% Fib at 0.6955.
- Upside finds major resistance at 0.7122 (converged 21 and 55 EMAs). Break above could see gains till 200-DMA. Bearish invalidation above 200-DMA.
Support levels - 0.7020 (50% Fib), 0.6955 (61.8% Fib)
Resistance levels - 0.7122 (converged 21 and 55 EMAs), 0.7186 (200-DMA)
Call update: Our previous call (https://www.econotimes.com/FxWirePro-AUD-USD-slips-below-100-DMA-doubts-over-Chinese-stimulus-weighs-1528086) has hit all targets.
For details on FxWirePro's Currency Strength Index, visit http://www.fxwirepro.com/currencyindex.


