


 FxWirePro- Major Pair levels and bias summary
  FxWirePro- Woodies pivot (Major)
  JPY Action Bias: USDJPY Emerges as the Clear Bullish Pair to Watch Amid Mixed Crosses
  FxWirePro- Major Crypto levels and bias summary
  GBPJPY Slips After Sterling Weakness, Bears Eye 216
  AUDJPY Weakness Deepens: Sell Rallies Toward 112 as Aussie Dollar Falters
  EUR/JPY Holds Bullish Bias as Euro Extends Recovery
  FxWirePro: EUR/AUD outlook weaker on renewed downside pressure
  FxWirePro: EUR/NZD up trend gains momentum but hurdles ahead
  FxWirePro: USD/CAD gaining momentum for a move towards 1.4200 level
  FxWirePro: GBP/USD edges higher as traders await BoE guidance and UK fiscal clarity
  EUR/USD Bounces from Monthly Low, But Bearish Pressure Remains
  FxWirePro : USD/JPY holds relatively bid on 163 ahead Of FOMC,BoJ meetings
  FxWirePro: AUD/USD dips after RBA Governor speech
  NZDJPY Pullback: Sell Rallies Toward 93.30 as Yen Weakness Eases


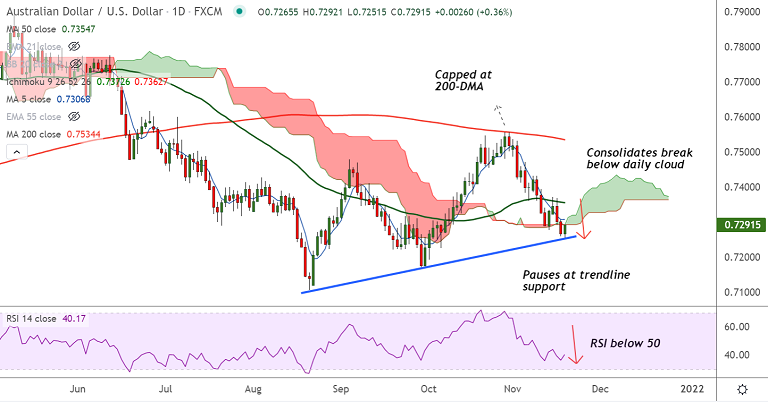
Chart - Courtesy Trading View
Technical Analysis:
GMMA Indicator
- GMMA indicator shows near-term trend is strongly bearish
- Long-term trend is turning bearish with constriction on long-term moving averages
Ichimoku Analysis
- Price action is consolidating break below daily cloud
Oscillators
- Stochs and RSI are bearishly aligned
- RSI is well below the 50 mark, supporting weakness
Bollinger Bands
- Volatility is high as evidenced by widening Bollinger bands
Major Support and Resistance Levels:
Support - 0.7250 (trendline), Resistance - 0.7306 (5-DMA)
Summary: AUD/USD trades with a bearish bias. Price action is consolidating break below daily cloud. The pair finds strong support at 0.7250 (trendline), break below will see downside resumption.







