


 Moldova Criticizes Russia Amid Transdniestria Energy Crisis
  Oil Prices Dip Slightly Amid Focus on Russian Sanctions and U.S. Inflation Data
  2025 Market Outlook: Key January Events to Watch
  U.S. Treasury Yields Expected to Decline Amid Cooling Economic Pressures
  Bank of America Posts Strong Q4 2024 Results, Shares Rise
  Energy Sector Outlook 2025: AI's Role and Market Dynamics
  NZDJPY: The Kiwi Yen's Bull Run Hits a Brick Wall at 92 — Sell the Rally?
  Sterling Slump Sends GBPJPY Toward 212.60 — Bearish EMA Stack Eyes 210
  China's Refining Industry Faces Major Shakeup Amid Challenges
  BTC Slips Below $60K as Institutional Demand Dries Up — Bears Eye $59K Support, Rallies to $63K for Shorts
  Wall Street Analysts Weigh in on Latest NFP Data
  Indonesia Surprises Markets with Interest Rate Cut Amid Currency Pressure
  FxWirePro- Woodies pivot (Major)
  US Gas Market Poised for Supercycle: Bernstein Analysts
  FxWirePro- Major Pair levels and bias summary
  EURJPY Bounce Loses Steam Below 184 — Sell-the-Rally Setup Eyes 183 Target
  Global Markets React to Strong U.S. Jobs Data and Rising Yields


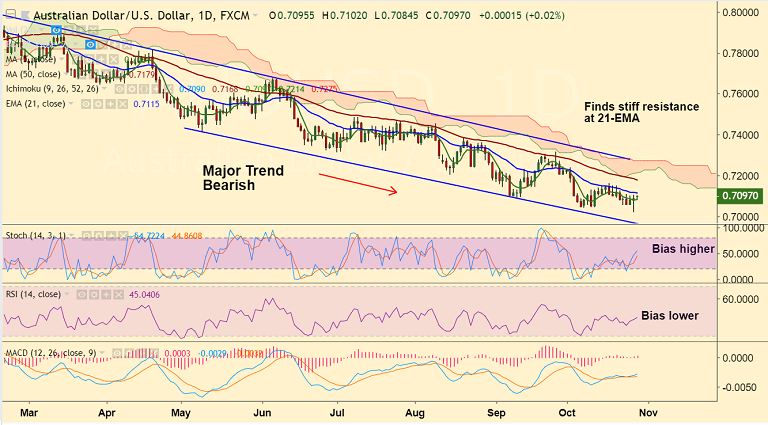
AUD/USD chart on Trading View used for analysis
- AUD/USD has shown a bounce off multi-month lows with a hammer formation.
- Weak China’s industrial profit growth in September likely to keep pressure on.
- China’s industrial profit growth slowed again in September, to 4.1% y/y from 9.2% in August.
- The year-to-date fell to 14.7% from 16.2% y/y ytd in August – much weaker than the 22.8% for the same period last year.
- Technical studies on intraday charts are turning slightly bullish. Price action has broken above 1H 200-SMA.
- Break above stiff resistance at 20-DMA could take the pair higher to test 0.7162 (Upper BB).
- Major trend in the pair is bearish. Rejection at 20-DMA could see resumption of weakness.
- Focus now on Australia consumer price inflation (CPI) data for Q3, scheduled to be released on October 31 by 00:30GMT.
Support levels - 0.7081 (5-DMA), 0.7021 (Oct 26 low)
Resistance levels - 0.7098 (20-DMA), 0.7162 (upper BB)
Recommendation: Watch out for decisive break above 20-DMA to go long
For details on FxWirePro's Currency Strength Index, visit http://www.fxwirepro.com/currencyindex.


