


 FxWirePro: USD/ZAR retreats but trend is still bullish
  FxWirePro : USD/JPY holds relatively bid on 163 ahead Of FOMC,BoJ meetings
  FxWirePro: NZD/USD edges lower, remains on back foot
  FxWirePro- Woodies pivot (Major)
  FxWirePro: GBP/NZD gains some ground but bias is still bearish
  FxWirePro: EUR/ AUD gains some ground , but remains on bearish path
  EUR/USD Bounces from Monthly Low, But Bearish Pressure Remains
  FxWirePro- Major Pair levels and bias summary
  Major Pairs Action Bias: USDCAD and USDCHF Stand Out as Extremely Bullish While GBPUSD and NZDUSD Turn Extremely Bearish
  FxWirePro: EUR/NZD up trend gains momentum but hurdles ahead
  FxWirePro: USD/CAD runs out of steam but maintains bullish outlook
  FxWirePro: GBP/AUD gains some upside momentum but still bearish
  JPY Action Bias: USDJPY Emerges as the Clear Bullish Pair to Watch Amid Mixed Crosses
  NZDJPY Pullback: Sell Rallies Toward 93.30 as Yen Weakness Eases
  FxWirePro: GBP/USD edges higher as traders await BoE guidance and UK fiscal clarity


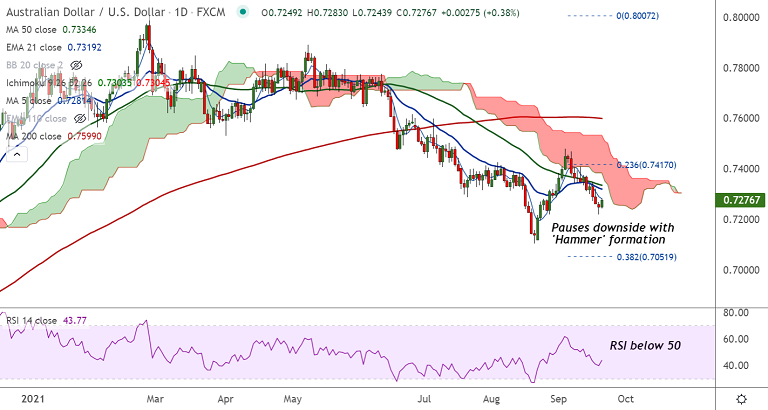
AUD/USD chart - Trading View
Spot Analysis:
AUD/USD was trading 0.39% higher on the day at 0.7277 at around 09:00 GMT
Previous Week's High/ Low: 0.7375/ 0.7262
Previous Session's High/ Low: 0.7268/ 0.7220
Fundamental Overview:
Earlier on Tuesday, minutes from the Reserve Bank of Australia (RBA) meeting showed the central bank's concern that the spread of the Delta variant could slow the economy's recovery once coronavirus lockdowns start to ease.
That said, the RBA still expects strong growth to resume next year. Australian 10-year bond futures were 0.328 points lower at 97.293, equivalent to a yield of 1.285%.
The US dollar edged lower in early European trade Tuesday, ahead of the start of this week’s crucial Federal Reserve meeting.
The Fed is likely to provide an outlook on how soon and how often they think the economy will need interest rate rises over the next three years.
Technical Analysis:
- AUD/USD has bounced off with 'Hammer' formation on Monday's trade
- The pair finds major support at 200-week MA, further weakness only on break below
- GMMA indicator shows bullish shift in minor trend on the intraday charts
- Price is testing 5-DMA resistance at 0.7281, break above will see more gains
Major Support and Resistance Levels:
Support - 0.7214 (200-week MA), Resistance - 0.7281 (5-DMA)
Summary: AUD/USD major trend remains bearish. Strong recovery looks elusive amid China property developer Evergrande's solvency issues and looming FOMC policy meeting.
Technical analysis still points to a bearish bias. Decisive break above cloud required for upside continuation. On the flipside, breach at 200-week MA support will drive more weakness.


