


 Major Forex Pairs Action Bias: GBPUSD and AUDUSD Turn Extremely Bearish
  Major FX Action Bias & US Market Sentiment: NZD/USD (Extremely Bullish) & AUD/USD (Bullish) Watchlist
  FxWirePro: EUR/AUD regains upwards momentum but unable to hold above 50%fib level
  FxWirePro: GBP/USD edges lower ahead of Fed policy verdict
  FxWirePro: GBP/USD rises as soft US data pressures dollar
  EURUSD Spikes to 1.14306 on Fed Pause as Traders Eye Sell-the-Rally Setup
  FxWirePro: GBP/AUD gains above 1.9200 level , upside pressure builds
  FxWirePro- Major Pair levels and bias summary
  FxWirePro: GBP/NZD remains weak, eyes 38.2%fib support
  Buy the Dips on EUR/JPY: Bullish Structure Points to 188 Target Ahead of Fed
  FxWirePro- Major Pair levels and bias summary
  FxWirePro: AUD/USD dips below lower range, bearish bias increases
  FxWirePro : GBP/NZD strongly bearish despite upside attempts
  FxWirePro: USD/ CNY hits one-month low,scope for futher downside
  AUD/JPY Slips Below 112 as BOJ Intervention Sparks Bearish Momentum: Sell the Rallies


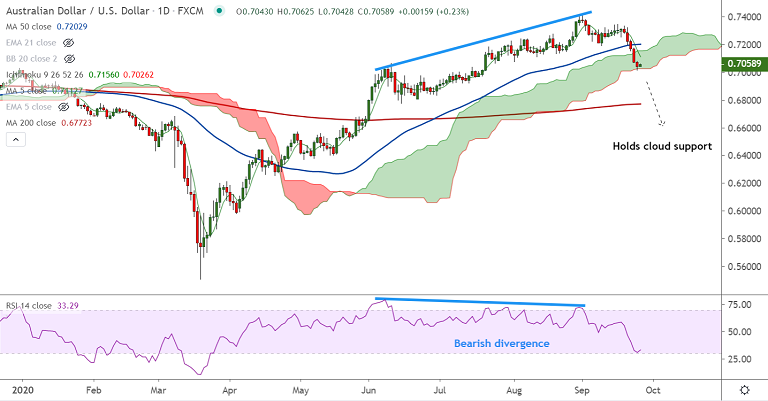
AUD/USD chart - Trading View
Technical Analysis: Bias Bearish
GMMA Indicator
- Major trend is neutral, minor trend is bearish on the daily charts
- Major trend is turning bullish, minor trend is bullish on the weekly charts
Ichimoku Analysis
- Downside price action has held support at cloud base on the daily charts
- The pair trades well above weekly cloud
Oscillators
- Stochs and RSI are biased lower on the weekly charts and are near oversold levels on the dailies
Bollinger Bands
- Widening Bollinger bands suggest rising volatility in the pair
Major Support Levels: 0.7008 (110-EMA), 0.6772 (200-DMA)
Major Resistance Levels: 0.7112 (5-DMA), 0.7131 (61.8% Fib)
Summary: Bearish bias for the pair in the near-term. Breach at daily cloud will drag the pair lower. Scope for test of 200-DMA. Violation at 200-DMA will open downside.


