


 FxWirePro- Major Pair levels and bias summary
  EURUSD Spikes to 1.14306 on Fed Pause as Traders Eye Sell-the-Rally Setup
  FxWirePro:EUR/NZD gains some upside momentum but still bearish
  FxWirePro: USD/ZAR firms ahead of Fed interest rate decision
  NZDJPY Bullish Rebound: Buy Dips as EMAs Align for 97 Target
  JPY Action Bias: EURJPY and CADJPY Emerge as Extremely Bullish Pairs to Watch
  FxWirePro- Major Crypto levels and bias summary
  Nikkei Surges Past 65,000 on Suspected Yen Weakness: Tech Giants Like Advantest and NEC Lead Explosive Gains
  FxWirePro: USD/JPY edges higher as focus shifts to BOJ decision
  FxWirePro: GBP/AUD drifts lower after BOE rate decision
  FxWirePro: GBP/USD edges lower ahead of Fed policy verdict
  NZD/JPY Flatlines Near 94.60: Will Key Support Reignite the Uptrend?
  FxWirePro: GBP/NZD remains weak, eyes 38.2%fib support
  FxWirePro: EUR/AUD regains upwards momentum but unable to hold above 50%fib level
  FxWirePro- Major Crypto levels and bias summary
  FxWirePro: USD/CAD slips after Fed holds rates steady
  FxWirePro: GBP/USD rises as soft US data pressures dollar


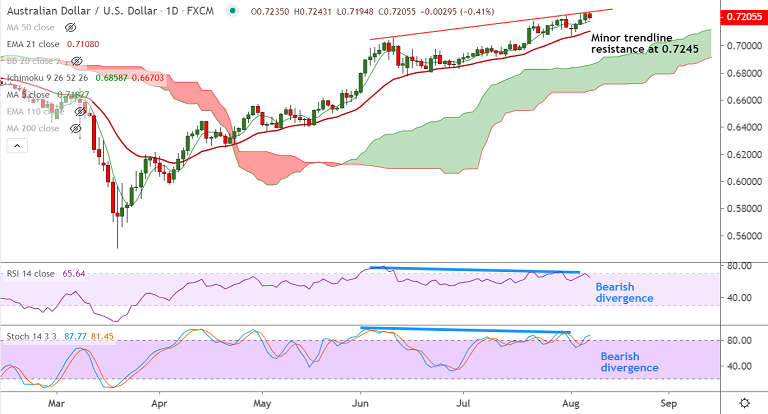
AUD/USD chart - Trading View
Technical Analysis: Bias Bullish
GMMA Indicator
- Minor and major trend are strongly bullish
- Price action is above major moving averages
Ichimoku Analysis
- The pair trades above cloud on the daily and weekly charts
- Chikou span shows some weakness on the daily charts
Oscillators
- Oscillators are at overbought levels
- Bearish divergence on the oscillators on the daily charts raises scope for some downside
Bollinger Bands
- Bollinger bands are wide on the daily and weekly charts
- Volatility to remain high
Major Support: 0.7107 (21-EMA)
Major Resistance: 0.7257 (200W MA)
Summary: Major trend in the pair is bullish. Overbought oscillator and bearish divergence can cause minor pullbacks. Focus on key U.S. NFP data for further impetus. Decisive break above 200W MA will fuel further gains.


