


 FxWirePro: USD/ZAR retreats but trend is still bullish
  FxWirePro: EUR/AUD outlook weaker on renewed downside pressure
  FxWirePro: USD/ZAR uptrend loses steam, remains on bullish path
  JPY Action Bias: USDJPY Emerges as the Clear Bullish Pair to Watch Amid Mixed Crosses
  AUDJPY Weakness Deepens: Sell Rallies Toward 112 as Aussie Dollar Falters
  EUR/USD Bounces from Monthly Low, But Bearish Pressure Remains
  EUR/JPY Holds Bullish Bias as Euro Extends Recovery
  AUDJPY Action Bias: Bullish Dip-Buy Setup Despite Flat Neutral Bias
  FxWirePro: EUR/NZD up trend gains momentum but hurdles ahead
  FxWirePro- Major Crypto levels and bias summary
  FxWirePro: GBP/USD edges higher as traders await BoE guidance and UK fiscal clarity
  NZDJPY Pullback: Sell Rallies Toward 93.30 as Yen Weakness Eases
  Crypto Action Bias: ETHUSD Stands Out as the Bullish Pair to Watch
  FxWirePro: NZD/USD edges lower, remains on back foot
  FxWirePro: USD/CAD runs out of steam but maintains bullish outlook


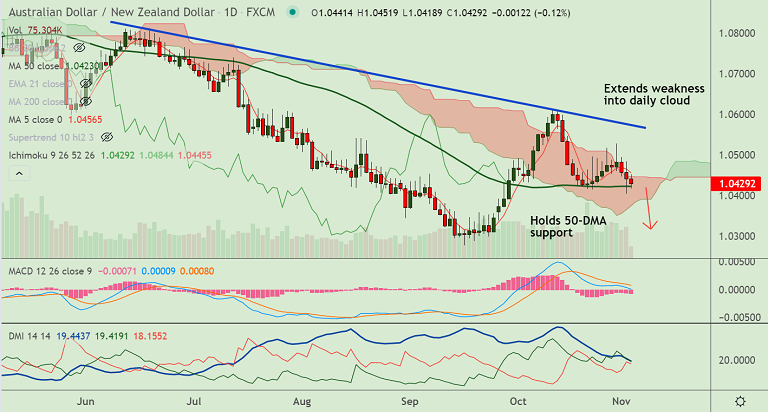
AUD/NZD chart - Trading View
Technical Analysis: Bias Bearish
- AUD/NZD extends weakness for the 3rd straight session
- The pair has slipped further into daily cloud, chikou span is biased lower
- 5-DMA has turned, the pair is holding support at 50-DMA
- Stochs and RSI show momentum is bearish, RSI is well below 50
- GMMA indicator shows near-term moving averages have turned bearish
Support levels - 1.0422 (50-DMA), 1.0373 (Lower BB), 1.0365 (Cloud base)
Resistance levels - 1.0455 (5-DMA), 1.0463 (55-EMA), 1.0485 (20-DMA)
Summary: AUD/NZD poised for further downside. Watch out for break below 50-DMA for further weakness.







