


 FxWirePro: AUD/USD eases as investors await U.S. employment figures
  FxWirePro: USD/JPY holds tight range ahead of key U.S. payrolls data
  EUR/USD Rockets Past 1.1560 as Soft U.S. Jobs Data Fuel Fed Rate-Cut Surge
  FxWirePro: GBP/AUD under pressure after disappointing U.S. employment data
  FxWirePro- Major Pair levels and bias summary
  FxWirePro- Woodies pivot (Major)
  EURGBP Bears Break Trendline: Sell Rallies at 0.8578 as Support Breach Eyes 0.8450 Slide
  NZDJPY Bears Lie in Wait: Sell Rallies at 93 for 90 Target with 94 Stop
  FxWirePro : EUR/NZD slips lower after soft US jobs report
  DAX & CAC40 Score Perfect 100: Extremely Bullish With Major Levels to Watch as FTSE100 Hits 80
  FxWirePro: EUR/AUD slips after surprise U.S. employment data
  FxWirePro: GBP/USD eases as dollar firms ahead of U.S. June non-farm payrolls report
  AUDJPY Bears Poised: Sell Rallies at 111.55 for 108 Target with 112.20 Stop
  FxWirePro- Major Pair levels and bias summary
  FxWirePro- Woodies pivot (Major)
  Major Pair Currency Score: NZD/USD and AUD/USD Lead Forex Rally with Perfect 100 Scores


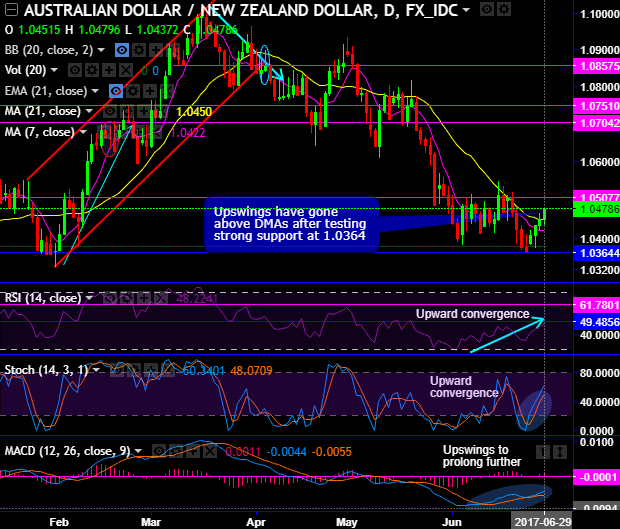
On the daily chart, the price behavior in short-term trend has moved above DMAs.
After the test of strong support at 1.0364 levels, this week has begun with the stern bulls’ attempts of bouncing back, the rallies could be extended upto next stiff resistances of 1.0507 levels.
On the contrary, the bearish engulfing candle with big real body & failure swings at channel resistance likely to extend slumps 1.0328 levels, momentum seems to have been bearish bias.
As a result, the current prices on this timeframe have gone below EMAs.
Well, considering the broader picture, the downswings have been slipping through sloping channel, every price bounces were rejected at this channel resistance and every dip were supported at baseline.
Bulls in short run seem to be gaining traction upto the next resistance of 1.0507 levels, expect more slumps in the major run.
While momentum indicators to substantiate this bearish stance.
Pivot points: 1.0507 and 1.0554 levels on northwards and 1.0328 and 1.0211 levels on southwards.
Both leading indicators (RSI & stochastic) are signaling differently on different time frames. RSI evidences the downward convergence with the ongoing price dips that signifies the strength of the bearish trend, (currently, RSI trending below 50 and 63 levels on daily and monthly terms respectively).
The strength in interim uptrend seems to be losing, historically the strength in upswings faded away at the 50 levels on the daily chart and 63 levels on the monthly chart.
While stochastic curve right from oversold zone has been evidencing %k crossover to signal the intensified bullish momentum on daily terms. This leading oscillator has been indecisive on monthly plotting.
MACD evidences bullish crossover on daily and remains below zero level on monthly terms, so we foresee bearish swings to be prolonged further.
Well, having said that we wrap up with concluding note, short-term bulls can speculate this pair whereas long-term investors at current juncture contemplating above bearish indications, we advocate shorting futures contract of mid-month expiries for target towards 1.0328 and upto 1.0211 levels cannot be ruled out upon breach of the 1st target.
Writers in a futures contract are expected to maintain margins in order to open and maintain a short futures position.
Currency Strength Index: FxWirePro's hourly AUD spot index has turned into -42 (which is mildly bullish), while hourly NZD spot index was at shy above -98 (bearish) at 06:34 GMT. For more details on the index, please refer below weblink:
http://www.fxwirepro.com/currencyindex.
FxWirePro launches Absolute Return Managed Program. For more details, visit:







