


 FxWirePro: NZD/USD downside pressure builds, key support level in focus
  Goldman Predicts 50% Odds of 10% U.S. Tariff on Copper by Q1 Close
  2025 Market Outlook: Key January Events to Watch
  AUDJPY Breaks Key Trendline Support — Bears Eye 110 as Momentum Accelerates
  Trump’s "Shock and Awe" Agenda: Executive Orders from Day One
  FxWirePro: USD/CNY hits one –month high, scope for further upside
  European Stocks Rally on Chinese Growth and Mining Merger Speculation
  Gold Prices Fall Amid Rate Jitters; Copper Steady as China Stimulus Eyed
  Fed May Resume Rate Hikes: BofA Analysts Outline Key Scenarios
  FxWirePro- Major Crypto levels and bias summary
  FxWirePro- Major Pair levels and bias summary
  Wall Street Analysts Weigh in on Latest NFP Data
  Lithium Market Poised for Recovery Amid Supply Cuts and Rising Demand
  Mexico's Undervalued Equity Market Offers Long-Term Investment Potential
  FxWirePro: AUD/USD drifts lower, uninspired by jobs beat
  Global Markets React to Strong U.S. Jobs Data and Rising Yields
  Sterling Slump Sends GBPJPY Toward 212.60 — Bearish EMA Stack Eyes 210


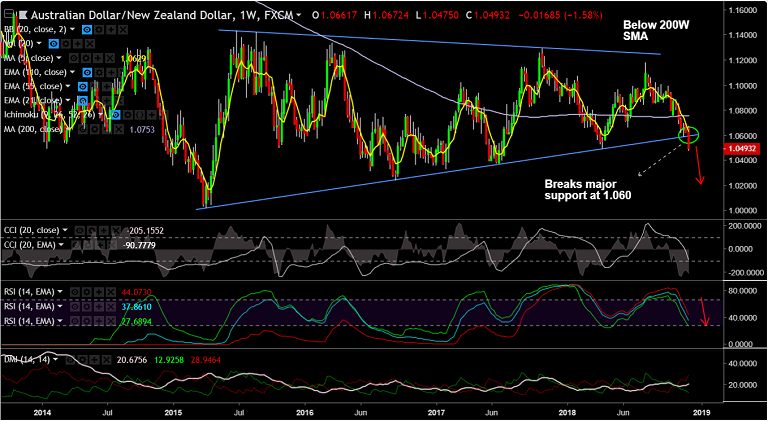
AUD/NZD chart on Trading View used for analysis
- AUD/NZD has broken "Symmetric Triangle" pattern, raising scope for further downside.
- The pair is extending weakness for the 6th straight session and hit 15-month lows at 1.0475.
- Breach at 'Triangle Base' support at 1.06 has opened up downside for the pair.
- Technicals support further weakness, drag till 1.0370 (Jun 2017 low) now likely.
- Technical indicators on weekly charts are also bearish. Stochs and RSI sharply lower.
- MACD supports downside. We see -ve DMI dominance and ADX rising in support of weakness.
- Price has slipped below weekly cloud and 200-W SMA and we see bearish invalidation only on retrace above.
Call update: Our previous call (https://www.econotimes.com/FxWirePro-AUD-NZD-Near-Term-Outlook-1467221) has hit targets.
Recommendation: Book partial profits, stay short for further downside. Target 1.0370.
For details on FxWirePro's Currency Strength Index, visit http://www.fxwirepro.com/currencyindex.


