


 FxWirePro- Major Crypto levels and bias summary
  FxWirePro: USD/ZAR uptrend loses steam, remains on bullish path
  FxWirePro- Woodies pivot (Major)
  FxWirePro: GBP/USD edges higher as traders await BoE guidance and UK fiscal clarity
  AUDJPY Weakness Deepens: Sell Rallies Toward 112 as Aussie Dollar Falters
  FxWirePro: NZD/USD edges lower, remains on back foot
  NZDJPY Pullback: Sell Rallies Toward 93.30 as Yen Weakness Eases
  EUR/JPY Holds Bullish Bias as Euro Extends Recovery
  FxWirePro: EUR/AUD outlook weaker on renewed downside pressure
  FxWirePro: USD/CAD runs out of steam but maintains bullish outlook
  FxWirePro: USD/CAD gaining momentum for a move towards 1.4200 level
  FxWirePro: USD/ZAR retreats but trend is still bullish
  GBPJPY Slips After Sterling Weakness, Bears Eye 216
  FxWirePro: GBP/AUD downside pressure builds, key support level in focus
  Major Pairs Action Bias: USDCAD and USDCHF Stand Out as Extremely Bullish While GBPUSD and NZDUSD Turn Extremely Bearish


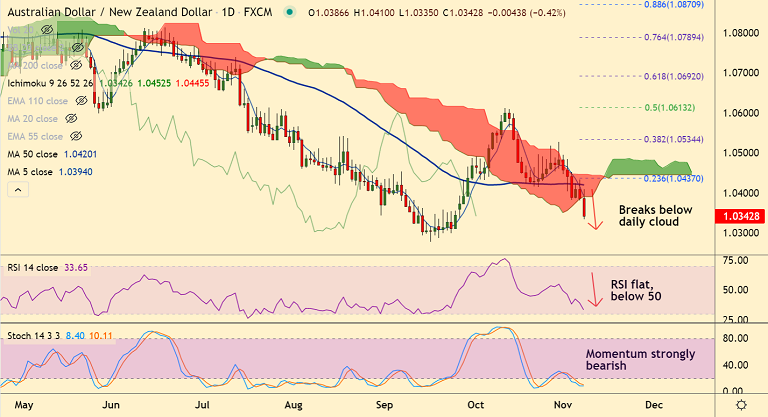
AUD/NZD chart - Trading View
Technical Analysis: Bias Bearish
- AUD/NZD was trading 0.41% lower on the day at 1.0343 at around 14:20 GMT.
- The pair has broken below daily cloud, Chikou span is biased lower.
- Momentum is strongly bearish, RSI is below 50, Stochs at oversold
- Volatility is high and rising as evidenced by widening Bollinger bands
- Major moving averages are biased lower, GMMA indicator shows bias is strongly bearish
Support levels - 1.03, 1.0279 (16th Sept low), 1.0258 (Lower W BB)
Resistance levels - 1.0390 (Cloud base), 1.0420 (50-DMA), 1.0435 (21-EMA)
Summary: AUD/NZD trades with a bearish bias. Break below daily cloud has opened downside. Scope for dip till 1.0250.







