


 Bitcoin Sheds $491M in ETF Outflows and Retreats Below $64K; Sellers Reload for $50K
  U.S. Banks Report Strong Q4 Profits Amid Investment Banking Surge
  NZDJPY Bears Reload as 92 Resistance Caps Bounce; Sell-on-Rallies Eyed Toward 90
  China's Refining Industry Faces Major Shakeup Amid Challenges
  FxWirePro: EUR/AUD bullish outlook with scope to target 1.6550
  Wall Street Analysts Weigh in on Latest NFP Data
  Lithium Market Poised for Recovery Amid Supply Cuts and Rising Demand
  FxWirePro: GBP/NZD gaining momentum for a move towards 2.3100 level
  Sterling Slump Sends GBPJPY Toward 212.60 — Bearish EMA Stack Eyes 210
  Moldova Criticizes Russia Amid Transdniestria Energy Crisis
  Gold Prices Slide as Rate Cut Prospects Diminish; Copper Gains on China Stimulus Hopes
  Bank of America Posts Strong Q4 2024 Results, Shares Rise
  Gold Prices Fall Amid Rate Jitters; Copper Steady as China Stimulus Eyed
  FxWirePro- Major Pair levels and bias summary
  FxWirePro- Woodies pivot (Major)
  BTC Slips Below $60K as Institutional Demand Dries Up — Bears Eye $59K Support, Rallies to $63K for Shorts
  AUDJPY Breaks Key Trendline Support — Bears Eye 110 as Momentum Accelerates


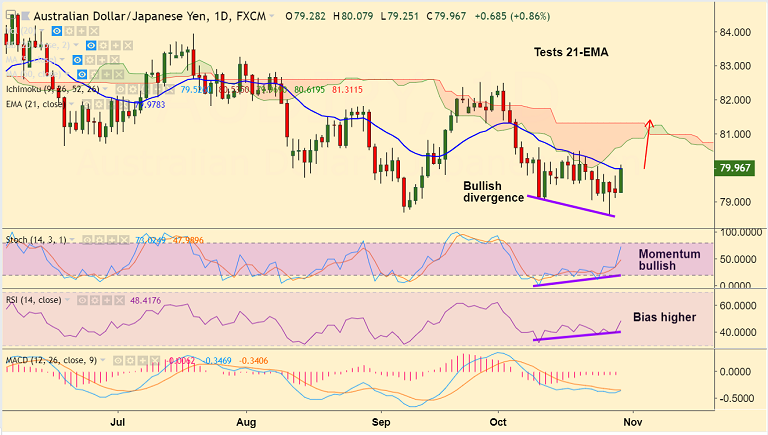
AUD/JPY chart on Trading View used for analysis
- AUD/JPY tests 21-EMA at 79.98, break above to see further upside.
- The pair has spiked 0.92% on the day and is trading at 80.00 at the time of writing.
- Technical indicators have turned bullish and we see scope for further upside.
- Stochs and RSI have turned higher and MACD is on verge of bullish crossover on signal line.
- We also evidence 'Bullish Divergence' on RSI and Stochs which adds to the bullish bias.
- Breakout at 21-EMA eyes 55-EMA at 80.57 ahead of daily cloud at 80.61. Rejection at 21-EMA could see weakness till 78.56.
- Investors look forward to BoJ on Wednesday for fresh directional impetus.
Support levels - 79.48 (5-DMA), 78.90 (lower BB), 78.56 (Oct 26 low)
Resistance levels - 80.57 (55-EMA), 81.30 (110-EMA), 82.31 (200-DMA)
For details on FxWirePro's Currency Strength Index, visit http://www.fxwirepro.com/currencyindex.


