


 Fed-ECB Policy Chasm Sends EURUSD Tumbling to 1.1375; Bearish Momentum Builds Toward 1.1300
  FxWirePro: GBP/NZD gaining momentum for a move towards 2.3350level
  FxWirePro: USD/CNY hits one –month high, scope for further upside
  Goldman Predicts 50% Odds of 10% U.S. Tariff on Copper by Q1 Close
  Pound-Yen Pullback: GBP/JPY Slips Below Key EMAs as Sterling Weakness Fuels Bearish Bet on 210
  Mexico's Undervalued Equity Market Offers Long-Term Investment Potential
  FxWirePro- Major Crypto levels and bias summary
  Peace Dividend Powers NZDJPY Past 93.50 — Bulls Set Sights on 96.15 Target
  S&P 500 Relies on Tech for Growth in Q4 2024, Says Barclays
  European Stocks Rally on Chinese Growth and Mining Merger Speculation
  Gold Prices Fall Amid Rate Jitters; Copper Steady as China Stimulus Eyed
  Stock Futures Dip as Investors Await Key Payrolls Data
  Lithium Market Poised for Recovery Amid Supply Cuts and Rising Demand
  FxWirePro: NZD/USD downside pressure builds, key support level in focus


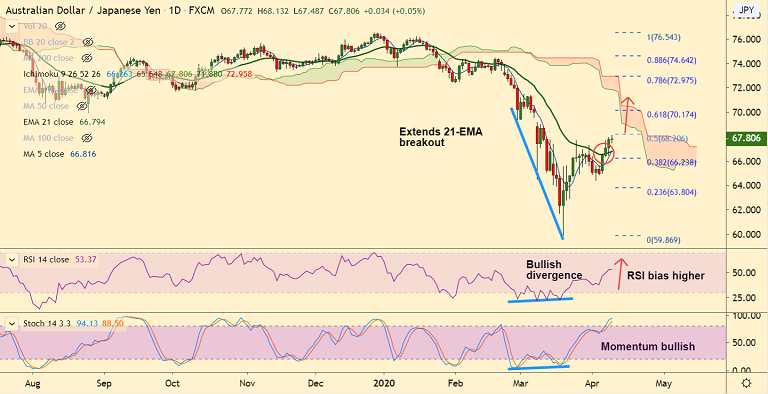
AUD/JPY chart - Trading View
AUD/JPY was trading in tight ranges on the day with session high at 68.132 and low at 67.487.
The pair has formed a 'Doji' on the daily candle at the time of writing suggesting indecision among traders.
RBA’s financial stability review dents Aussie. The RBA noted that high uncertainty to weigh over the banks’ performance and economy.
Technical indicators however, support upside in the pair. Stochs are sharply higher and RSI holds above 50 mark.
Price action has broken above 21-EMA and volatility is rising as evidenced by widening Bollinger bands.
The pair has paused upside at 50% Fib at 68.20. Scope for gains till 61.8% Fib at 70.17.
On the flipside, strong support is seen at 66.80 (nearly converged 5-DMA and 21-EMA). Retrace below negates any bullish bias.
Support levels - 66.80 (nearly converged 5-DMA and 21-EMA), 65.67 (20-DMA)
Resistance levels - 68.38 (Upper BB), 69.08 (55-EMA)


