


 FxWirePro: GBP/USD edges higher as traders await BoE guidance and UK fiscal clarity
  FxWirePro: USD/CAD runs out of steam but maintains bullish outlook
  EUR/JPY Holds Bullish Bias as Euro Extends Recovery
  JPY Pairs Action Bias: EURJPY Leads as Bullish Standout Amid Mixed Momentum
  FxWirePro : USD/JPY holds relatively bid on 163 ahead Of FOMC,BoJ meetings
  FxWirePro: NZD/USD neutral in the near-term, scope for downward resumption
  Major Pairs Action Bias: USDCAD and USDCHF Stand Out as Extremely Bullish While GBPUSD and NZDUSD Turn Extremely Bearish
  FxWirePro: GBP/AUD downside pressure builds, key support level in focus
  FxWirePro: EUR/ AUD gains some ground , but remains on bearish path
  FxWirePro- Major Pair levels and bias summary
  EUR/USD Bounces from Monthly Low, But Bearish Pressure Remains
  FxWirePro: USD/CAD gaining momentum for a move towards 1.4200 level
  FxWirePro: GBP/NZD maintains bersish bias with focus on 2.2900 level
  FxWirePro: EUR/AUD outlook weaker on renewed downside pressure
  NZDJPY Pullback: Sell Rallies Toward 93.30 as Yen Weakness Eases


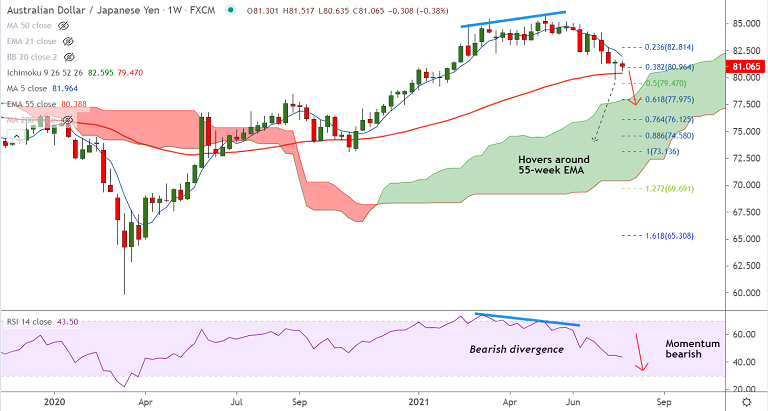
AUD/JPY chart - Trading View
Spot Analysis:
AUD/JPY was trading 0.12% higher on the day at 81.02 at around 08:35 GMT
Previous Week's High/ Low: 81.65/ 79.83
Previous Session's High/ Low: 81.35/ 80.75
Fundamental Overview:
Australia’s Q2 Producer Price Index (PPI) rose past 0.2% forecast and 0.4% prior to 0.7% QoQ whereas the Private Sector Credit for June also crossed 0.1% expectations and 0.4% previous readouts to 0.9% MoM.
Resurging covid numbers weigh on the market sentiment and put a bid under the safe-haven assets like the yen.
Japan witnesses above 10,000 cases for the first time and stays ready to take more prefectures under virus-led emergency.
Technical Analysis:
- AUD/JPY has ignored last week's Dragonfly Doji formation and is extending weakness
- Price action has slipped below 200-DMA, momentum studies are bearish
- GMMA indicator shows major and minor trend are bearish
- Volatility is high and rising, Chikou span is biased lower
Major Support and Resistance Levels:
Support - 80.38 (55-week EMA), Resistance - 81.34 (200-DMA)
Summary: AUD/JPY was trading below 200-DMA resistance. The pair shows bearish bias. Break below 55-week EMA will plummet prices.


