


 FxWirePro: GBP/AUD downside pressure builds, key support level in focus
  EUR/JPY Holds Bullish Bias as Euro Extends Recovery
  JPY Action Bias: USDJPY Emerges as the Clear Bullish Pair to Watch Amid Mixed Crosses
  FxWirePro: AUD/USD falls after softer-than-expected Australian Q2 CPI
  FxWirePro: NZD/USD edges lower, remains on back foot
  FxWirePro: USD/ CNY remains soft ahead of Fed decision
  AUDJPY Weakness Deepens: Sell Rallies Toward 112 as Aussie Dollar Falters
  JPY Pairs Action Bias: EURJPY Leads as Bullish Standout Amid Mixed Momentum
  FxWirePro: EUR/ AUD gains some ground , but remains on bearish path
  FxWirePro: NZD/USD neutral in the near-term, scope for downward resumption
  FxWirePro : USD/JPY holds relatively bid on 163 ahead Of FOMC,BoJ meetings
  NZDJPY Pullback: Sell Rallies Toward 93.30 as Yen Weakness Eases
  FxWirePro: EUR/AUD outlook weaker on renewed downside pressure
  FxWirePro: USD/JPY eases ahead of Fed decision , Intervention risks linger
  Major Pairs Action Bias: USDCAD and USDCHF Stand Out as Extremely Bullish While GBPUSD and NZDUSD Turn Extremely Bearish


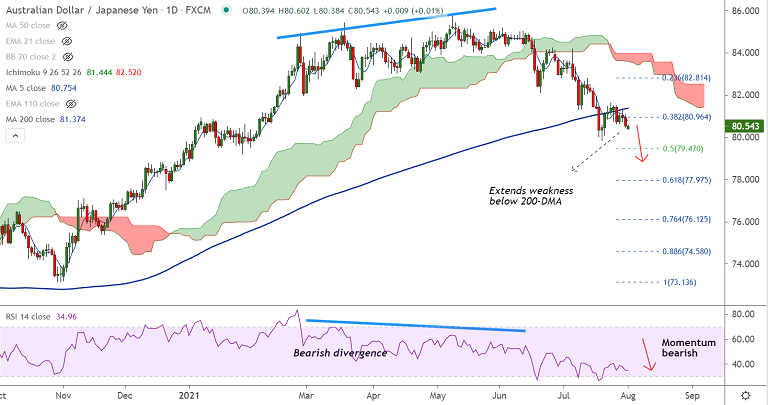
AUD/JPY chart - Trading View
Spot Analysis:
AUD/JPY was trading rangebound on the day at 80.54, with session high at 80.60 and low at 80.38
Previous Week's High/ Low: 81.51/ 80.45
Previous Session's High/ Low: 81.08/ 80.45
Fundamental Overview:
Poor China data and risk-off market sentiment are likely to keep upside in the pair limited ahead of crucial RBA policy meet.
A survey by Markit Economics showed on Monday that China's factory activity growth slipped sharply in July as demand contracted for the first time in over a year.
Caixin China Manufacturing PMI for July printed at 50.3, missing expectations at 51.1 and compared to 51.3 in June.
Focus now shifts to the Reserve Bank of Australia’s (RBA) monetary policy meeting due this Tuesday at 0430 GMT.
Analysts expect the RBA to stand pat amid resurging Delta covid strain woes. Further, falling iron ore prices add downside pressure.
Technical Analysis: Bias Bearish
- AUD/JPY is extending weakness below 200-DMA
- 5-DMA has turned and is biased sharply lower
- Momentum is bearish, Stochs and RSI are sharply lower
- Volatility is high and rising as evidenced by widening Bollinger bands
Major Support and Resistance Levels:
Support - 80.37 (55-week EMA), Resistance - 81.37 (200-DMA)
Summary: AUD/JPY trades with a bearish bias. A dovish RBA on Tuesday could trigger further weakness.
Watchout for decisive break below 55-week EMA for downside. Next bear target lies at 50% Fib retracement at 79.47. Bearish invalidation only above 200-DMA.


