


 FxWirePro:EUR/NZD gains some upside momentum but still bearish
  FxWirePro: GBP/USD rises as soft US data pressures dollar
  NZDJPY Retreats on Yen Strength – Bearish Setup Targets 90 After Hitting 92.75 Low
  AUD/JPY Slips Below 112 as BOJ Intervention Sparks Bearish Momentum: Sell the Rallies
  FxWirePro: USD/CNY dips to hit three year low,scope for further downside
  FxWirePro: GBP/NZD remains weak, eyes 38.2%fib support
  NZDJPY Bullish Rebound: Buy Dips as EMAs Align for 97 Target
  FxWirePro : GBP/NZD strongly bearish despite upside attempts
  Nikkei Surges Past 65,000 on Suspected Yen Weakness: Tech Giants Like Advantest and NEC Lead Explosive Gains
  FxWirePro: EUR/AUD regains upwards momentum but unable to hold above 50%fib level
  FxWirePro- Woodies pivot (Major)
  FxWirePro- Major Pair levels and bias summary
  Major FX Action Bias & US Market Sentiment: NZD/USD (Extremely Bullish) & AUD/USD (Bullish) Watchlist
  FxWirePro: USD/ CNY hits one-month low,scope for futher downside
  FxWirePro: USD/JPY edges higher as focus shifts to BOJ decision
  AUDJPY Volatile After Massive Sell-Off: Sell Rallies at 113, Targeting 110 as Bearish Momentum Surges


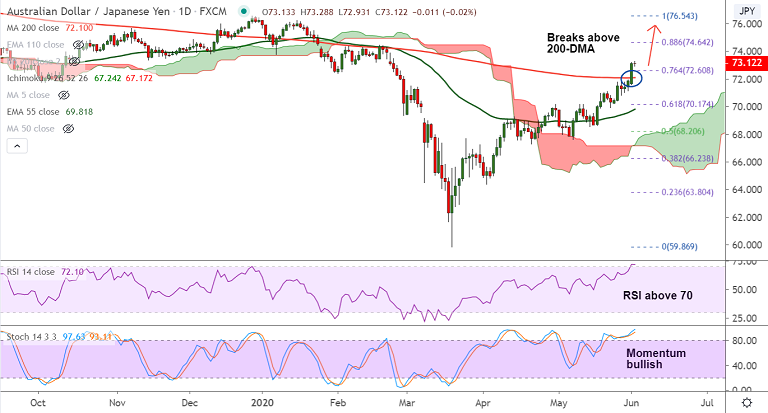
AUD/JPY chart - Trading View
Technical Analysis: Bias Strongly Bullish
GMMA Indicator
- Major and minor trend are strongly bullish
- GMMA shows potential for further gains
Ichimoku Analysis
- Price action is well above daily cloud
- Chikou Span is biased higher and signals upside continuation
Oscillators
- Oscillators are bullishly aligned, RSI is above 70 which supports upside momentum
- Stochastics show bullish momentum, are at overbought levels, but do not show any signs of reversal
Bollinger Bands
- Bollinger bands are widening on the daily charts
- Rising volatility with bullish momentum could carry the pair higher
Major Support Levels: 72.80 (55W EMA), 72.10 (200-DMA), 70.66 (21-EMA)
Major Resistance Levels: 74.64 (88.6% Fib), 75.73 (110W EMA), 76.54 (Dec 2019 high)
Summary: Price action has shown a decisive breakout at 200-DMA and has edged above 55W EMA resistance at 72.80. The RBA is unlikely to throw any major surprises. Any dips can be used to enter a long position. The pair is likely to target 88.6% Fib at 74.64 ahead of 110W EMA at 75.73 and Dec 2019 hghs at 76.54.


