


 FxWirePro: GBP/NZD gaining momentum for a move towards 2.3350level
  Oil Prices Dip Slightly Amid Focus on Russian Sanctions and U.S. Inflation Data
  BTC Slips Below $60K as Institutional Demand Dries Up — Bears Eye $59K Support, Rallies to $63K for Shorts
  FxWirePro- Woodies pivot (Major)
  U.S. Stocks vs. Bonds: Are Diverging Valuations Signaling a Shift?
  Lithium Market Poised for Recovery Amid Supply Cuts and Rising Demand
  Gold Prices Slide as Rate Cut Prospects Diminish; Copper Gains on China Stimulus Hopes
  FxWirePro: USD/CNY hits one –month high, scope for further upside
  AUDJPY Breaks Key Trendline Support — Bears Eye 110 as Momentum Accelerates
  Geopolitical Shocks That Could Reshape Financial Markets in 2025
  Energy Sector Outlook 2025: AI's Role and Market Dynamics
  Bitcoin Sheds $491M in ETF Outflows and Retreats Below $64K; Sellers Reload for $50K
  FxWirePro: USD/JPY edges higher as the yen remains vulnerable despite repeated warnings of intervention.
  AUDJPY Bears Take a Breather at 111.50, But ‘Sell on Rallies’ Still Eyes 110
  FxWirePro- Major Crypto levels and bias summary
  Moldova Criticizes Russia Amid Transdniestria Energy Crisis


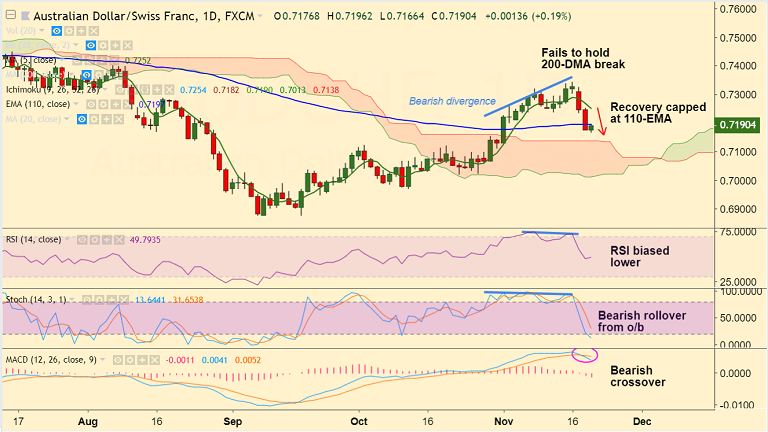
AUD/CHF chart on Trading View used for analysis
- AUD/CHF has resumed downside after brief pause on Wednesday's trade.
- Price is extending weakness after failure to hold break above 200-DMA, slips lower with a spinning top formation.
- Technical indicators on daily charts are bearish. Stochs and RSI have rolled are biased lower.
- We see bearish divergence on RSI and Stochs which adds to the bearish bias.
- 5-DMA is sharply lower and MACD is showing a bearish crossover on signal line.
- The pair is currently holding strong support at 110-EMA, break below to see major weakness.
- Next major support below 110-EMA lies at 21-EMA at 0.7212 ahead of 0.7136 (converged trendline and cloud top)
Support levels - 0.7198 (110-EMA), 0.7212 (21-EMA), 0.7136 (cloud top and trendline), 0.71
Resistance levels - 0.7213 (5-DMA), 0.7292 (200-DMA), 0.73
For details on FxWirePro's Currency Strength Index, visit http://www.fxwirepro.com/currencyindex.


