


 RBA Expected to Raise Interest Rates by 25 Basis Points in February, ANZ Forecast Says
  Federal Reserve Faces Subpoena Delay Amid Investigation Into Chair Jerome Powell
  Why Trump’s new pick for Fed chair hit gold and silver markets – for good reasons
  Bank of Japan Signals Readiness for Near-Term Rate Hike as Inflation Nears Target
  RBI Holds Repo Rate at 5.25% as India’s Growth Outlook Strengthens After U.S. Trade Deal


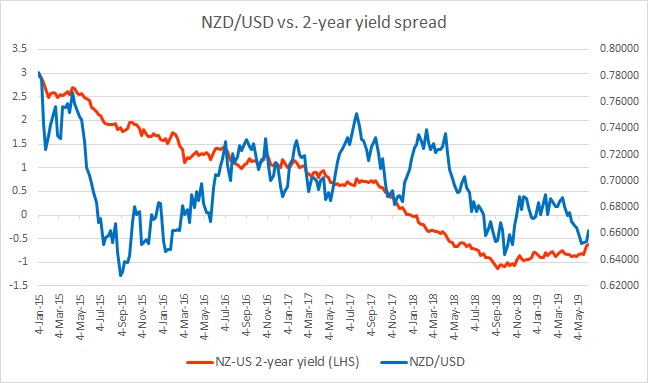
The chart above shows, how the relationship between NZD/USD and 2-year yield divergence has unfolded since 2015.
While the spread has narrowed steadily from +300 basis points (bps) in January 2015 to -106 bps as of September 2018, the New Zealand dollar has been pretty volatile around the spread. However, from the chart, it’s quite clear that the direction of the spread is playing a crucial role over the medium to long term.
We have forecasted a lower NZD against the USD with a target of 0.59 against the USD over the medium to long term, and with the Reserve Bank of New Zealand (RBNZ) continuing its dovish rhetoric, we expect the spread to decline further in favor of the USD.
As the spread started narrowing in favor of the New Zealand dollar since September, the New Zealand dollar rose against the USD. Since September, the spread has narrowed from -112 bps to -80 bps as of March, as the Kiwi is up from 0.65 area to testing the 0.69 resistance area.
However, as RBNZ reduced rates by 25 bps n April, the spread has once again widened to-84 bps and the New Zealand dollar declined to 0.658 against the USD.
In June, the spread has continued to narrow and rose to -62 bps, while NZD/USD consolidating around 0.662 area.


