


 FxWirePro- Major Crypto levels and bias summary
  BTC’s Bear Bounce: Sell the Rally Near $66K as Bears Target $59K–$52K Breakdown
  Ethereum Cracks Under $1,700: Sell the Rally Near $1,750 as Bears Eye $1,380–$1,200
  FxWirePro- Major Crypto levels and bias summary
  FxWirePro- Major Crypto levels and bias summary


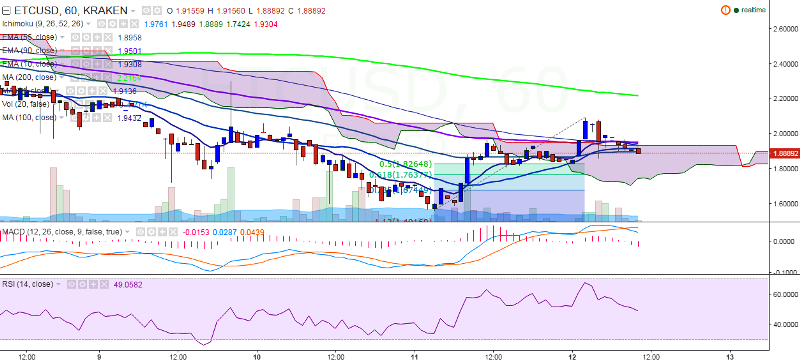
ETC/USD has sharply declined on Friday, falling to 1.83 levels, before hitting a high of 2.09 levels. It currently trades at 1.88 levels at the time of writing (Kraken).
Ichimoku analysis of hourly chart:
Tenkan Sen: 1.97
Kijun Sen: 1.90
Trend reversal: 1.95 (90-hour EMA)
The pair has slipped below 90-hour EMA after hitting 2.09 levels. On the upside, it should break above this trend line (1.95 levels) for further upside. A consistent break above would take the pair to 2.09 levels (Aug 12 high) and then to 1.22 levels (200-hour MA).
On the reverse side, support is seen at 1.76 levels (61.8% retracement of 1.56 and 2.09 levels) and a break below would drag the pair to 1.56 levels/1.41 (July 31 low).

- News

- Economy

- Central Banks
- Investing
- Research
- Roundups
- Digital Currency
- Insights
- Technical Analysis
- Technology
- Business
- Law
- Health
- Nature
- Fintech
- Science
- Topic
- Opinions
- ©Econometrics LLC . All Rights Reserved.
ETC/USD plunges below 90-hour EMA, targets 1.76
Friday, August 12, 2016 11:24 AM UTC
Editor's Picks


- Market Data
Most Popular


