


 FxWirePro- Major Pair levels and bias summary
  FxWirePro: GBP/USD hits one-month high, scope for further upside
  Crypto Major Pair Action Bias: ETHUSD Bullish as BTCUSD, SOLUSD & XRPUSD Stay Neutral
  FxWirePro: NZD/USD steadies around 0.5830,retains bid tone
  AUDJPY Extremely Bullish Above 113: Strong AUD Fuels Fresh Rally – Buy Dips at 113 Targeting 115
  Major Pair Action Bias: Extremely Bullish Surge Powers GBPUSD & NZDUSD as Bullish Momentum Ignites
  NZDJPY Bullish Surge: Strong Kiwi Ignites Fresh Upside as 94 Support Holds and All EMAs Align


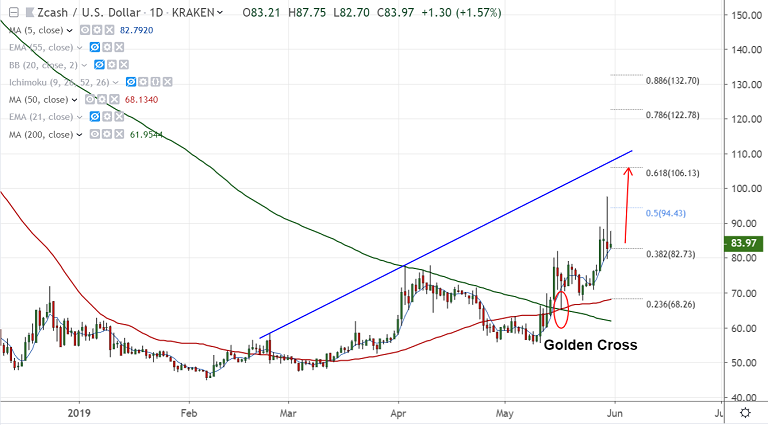
ZEC/USD chart - Trading View
Exchange - Kraken
Support: 75 (21-EMA); Resistance: 106.13 (61.8% Fib)
Technical Analysis: Bias Bullish
ZEC/USD slips lower from new 6-month highs at 97.59 hit on Thursday's trade.
Price action is holding above immediate support at 5-DMA (82.82).
Technical indicators are biased higher. Price action is above cloud and major moving averages.
A 'Golden Cross' formation on the daily charts keeps scope for upside in the pair.
Volatility is rising as evidenced by expanding Bollinger Bands.
Next major bull target lies at 61.8% Fib at 106.13 ahead of 55W-EMA at 111.30.
Break below 5-DMA finds strong support at 75 (nearly converged 20-DMA and 21-EMA).
Bullish invalidation likely on break below 200-DMA.
For details on FxWirePro's Currency Strength Index, visit http://www.fxwirepro.com/currencyindex.


